Tag: carbon emissions

  • Want to Save Money on Your Electricity Bill? Try Tracking Your Consumption

    Want to Save Money on Your Electricity Bill? Try Tracking Your Consumption

    Are you tired of high electricity bills and looking for ways to save money?

    One solution may be to start tracking your energy consumption. By understanding how much energy you use and where you use it, you can take steps to reduce your consumption and lower your costs.

    In this blog, we will discuss the benefits of tracking your energy consumption and provide simple and easy to understand examples on how to do it.

    Why is it important to track your energy consumption?

    One of the main benefits of tracking your energy consumption is that it allows you to identify areas where you can reduce your usage and lower your costs. For example, you may discover that you are using a lot of energy during peak hours when the rates are higher. By making simple adjustments, such as turning off lights and appliances during these hours, you can lower your energy costs.

    Another benefit of tracking your energy consumption is that it helps you identify appliances and devices that are using a lot of energy. For example, you may discover that your air conditioner or refrigerator is using a lot of energy. By upgrading to energy-efficient models or using smart power strips to control the power usage, you can lower your energy costs.

    Tracking your energy consumption can also help you identify patterns in your usage. For example, you may find that you use a lot of energy during the evenings when you are home. By making simple adjustments, such as turning off lights and appliances when you are not using them, you can lower your energy costs.

    How can you track your energy consumption?

    One way to track your energy consumption is by using a smart meter. Smart meters are devices that are installed by your energy provider that measure your energy usage in real-time. By using a smart meter, you can see how much energy you are using, when you are using it, and how much it is costing you. With this information, you can take steps to reduce your consumption and lower your costs.

    Another way to track your energy consumption is by using a monitoring device. There are various monitoring devices available on the market that can be plugged into your appliances and devices to track their energy usage. With this information, you can see which appliances and devices are using the most energy and take steps to reduce their usage.

    You can also track your energy consumption by using an energy tracking app on your smartphone. These apps allow you to track your energy usage, see your bills, and monitor your consumption in real-time. Additionally, many of these apps also provide tips on how to reduce your energy consumption and lower your costs.

    To illustrate the above, let’s take an example of a family of 4 living in a 2BHK apartment. By tracking their energy consumption, they found out that their air conditioner was the main energy consumer, they decided to use a programmable thermostat to control the temperature when they were not at home, and also implemented a rule of turning off the air conditioner when they left the house, in a year they managed to save around 20% of their energy bill.

    Another example, a small business owner found out that his lighting systems were consuming more energy than needed, by switching to LED lights and using motion sensors to control the lighting, he managed to save around 30% of his energy bill.

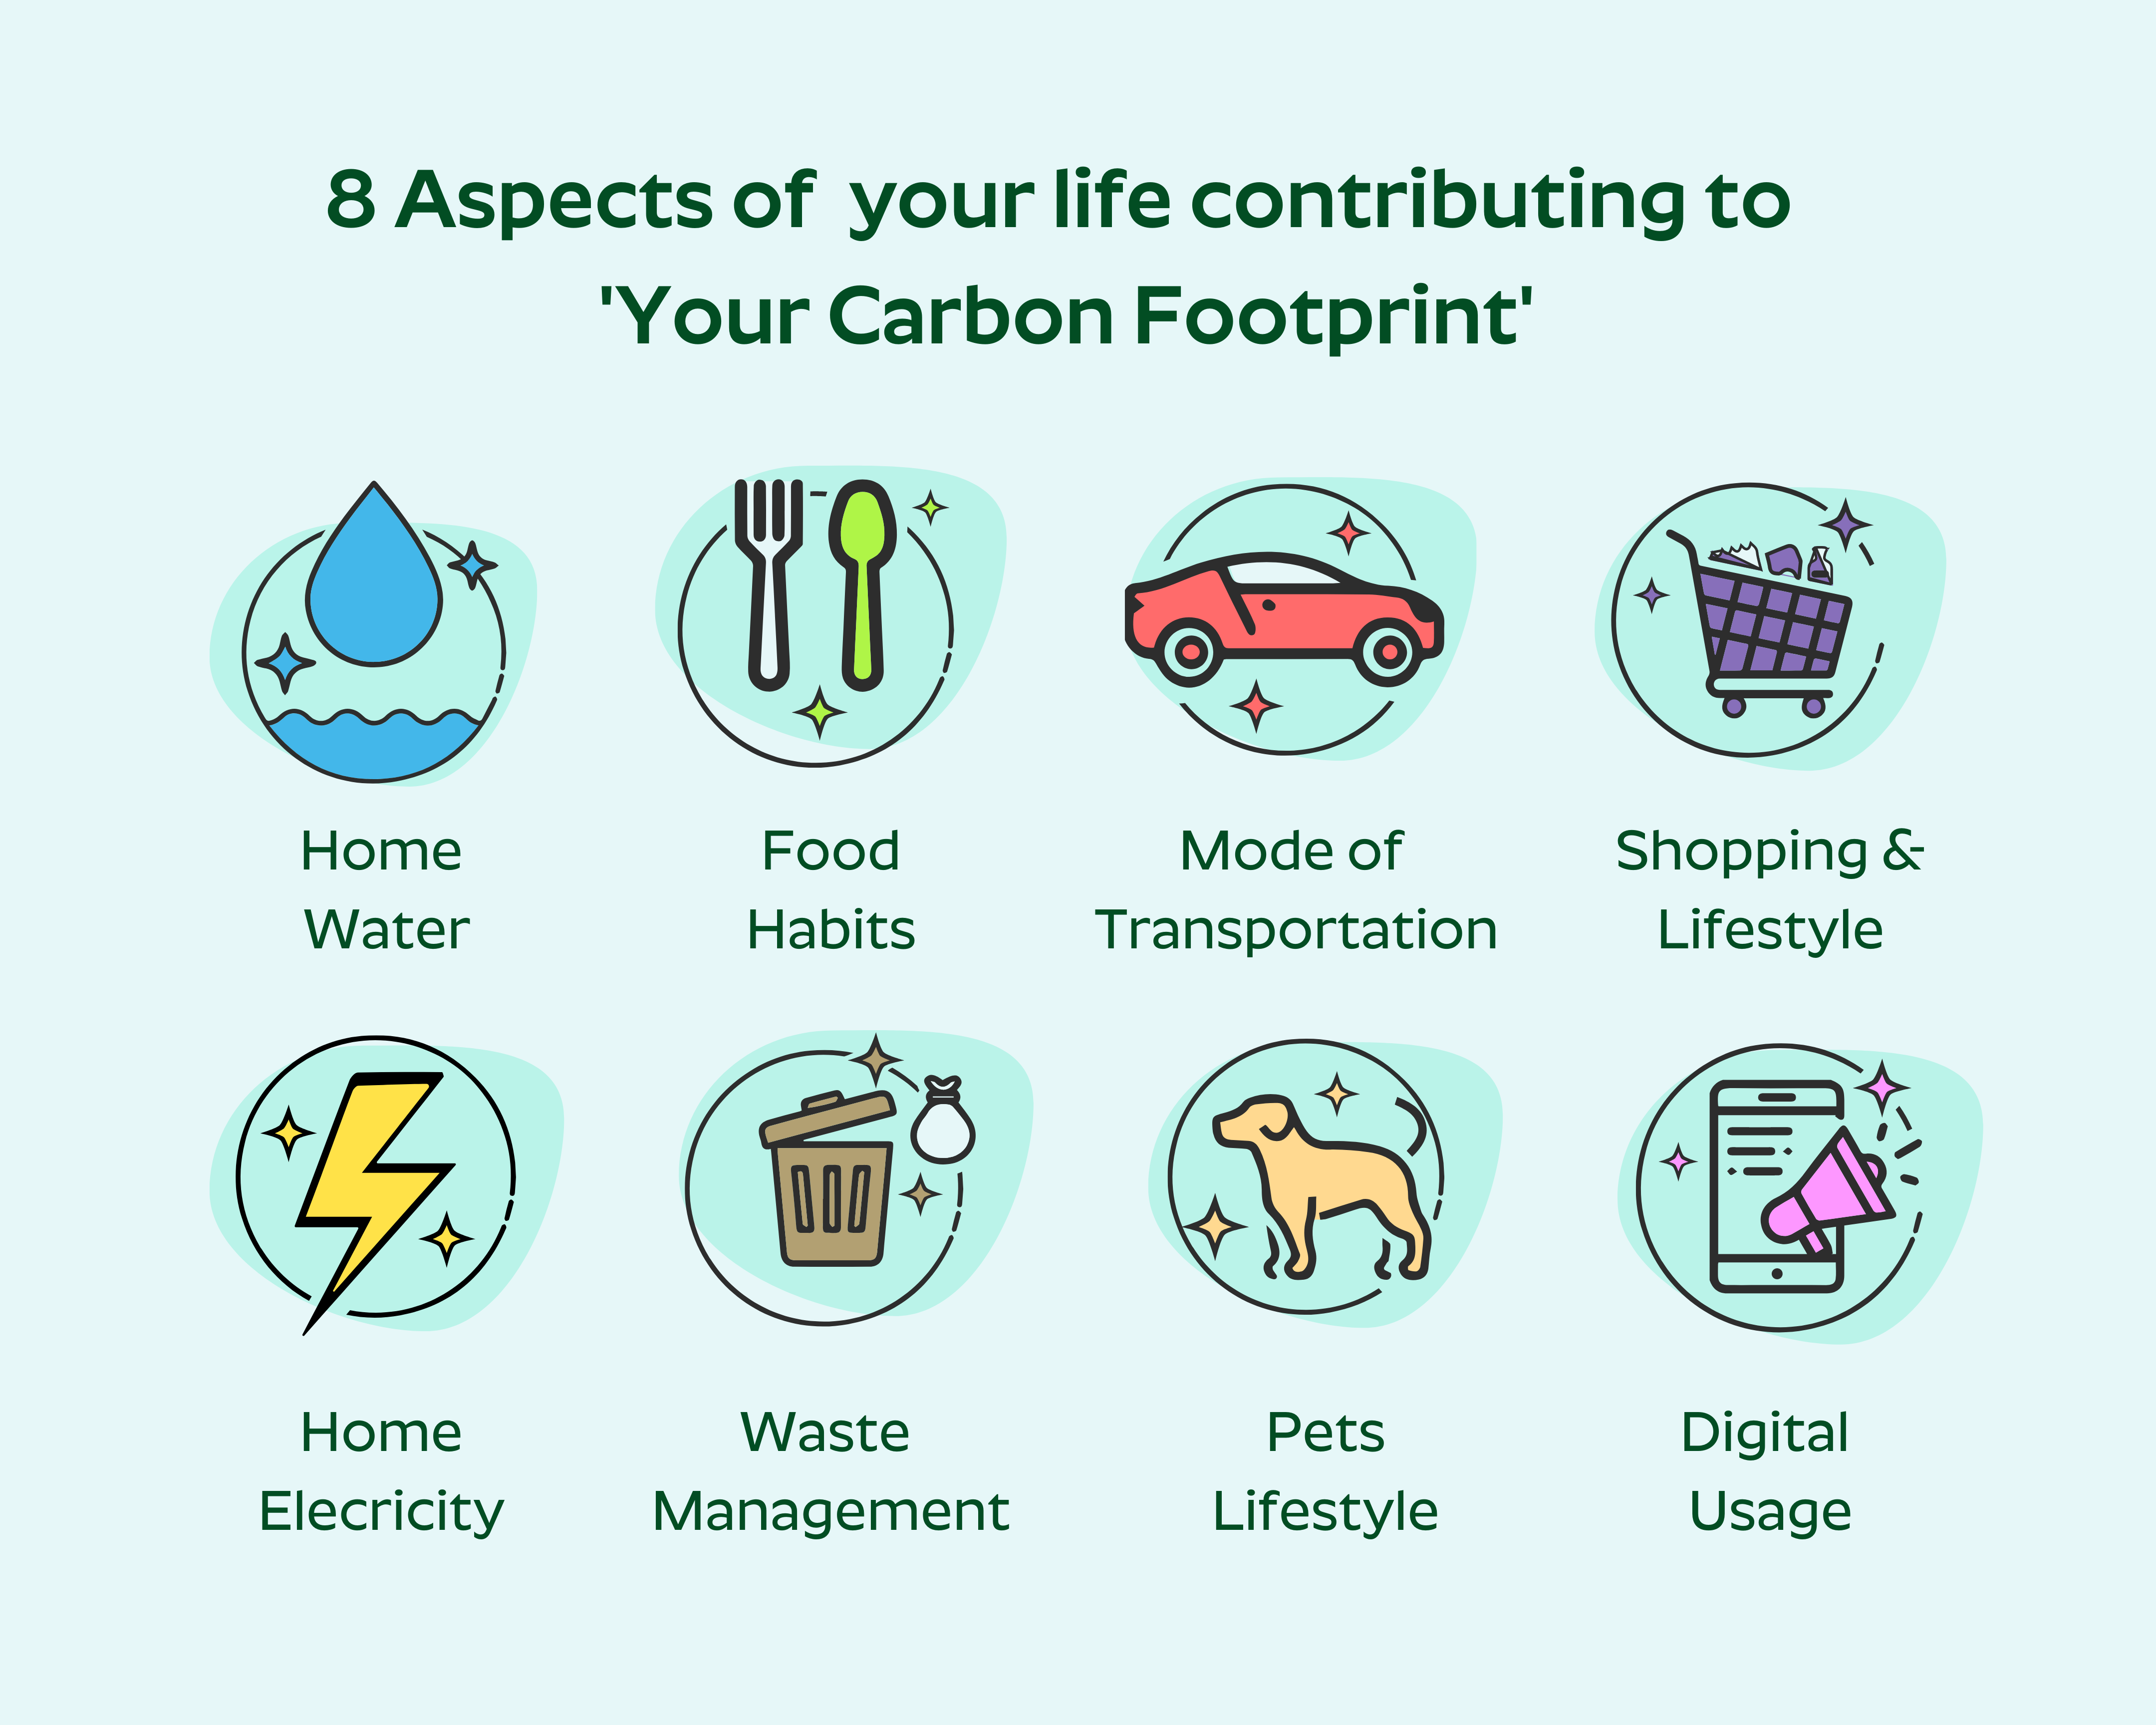
    How reducing energy consumption reduces your carbon footprint?

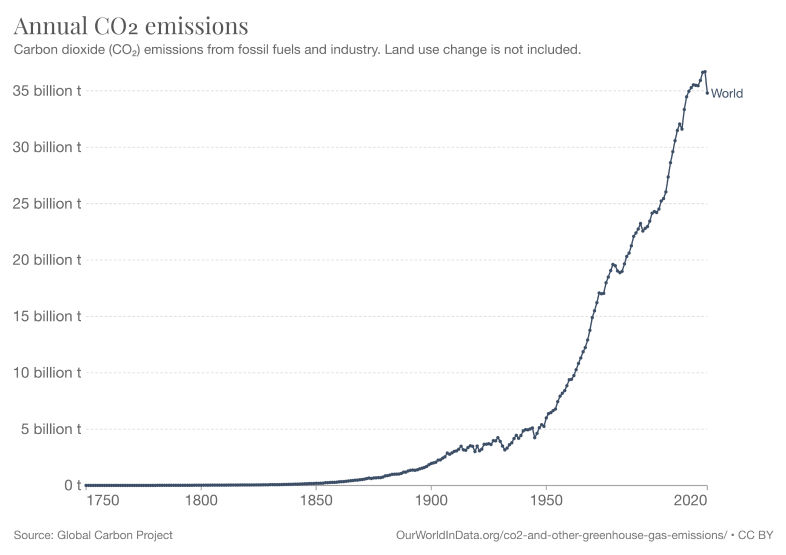
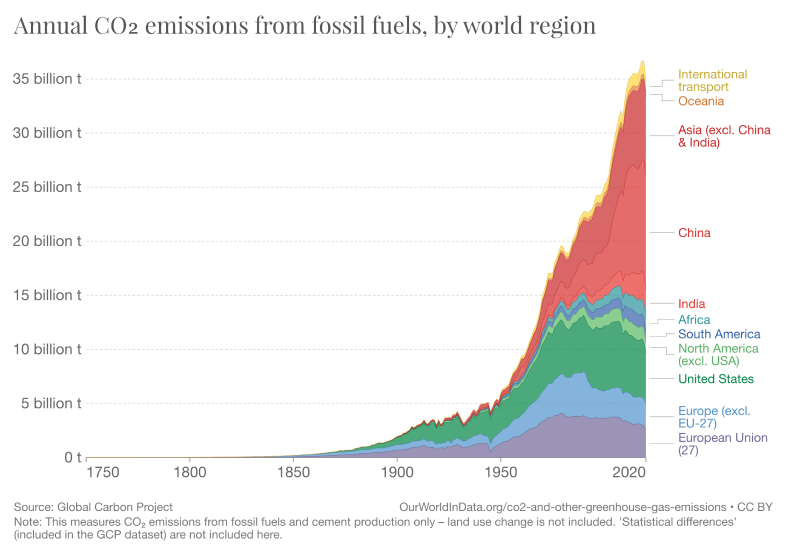
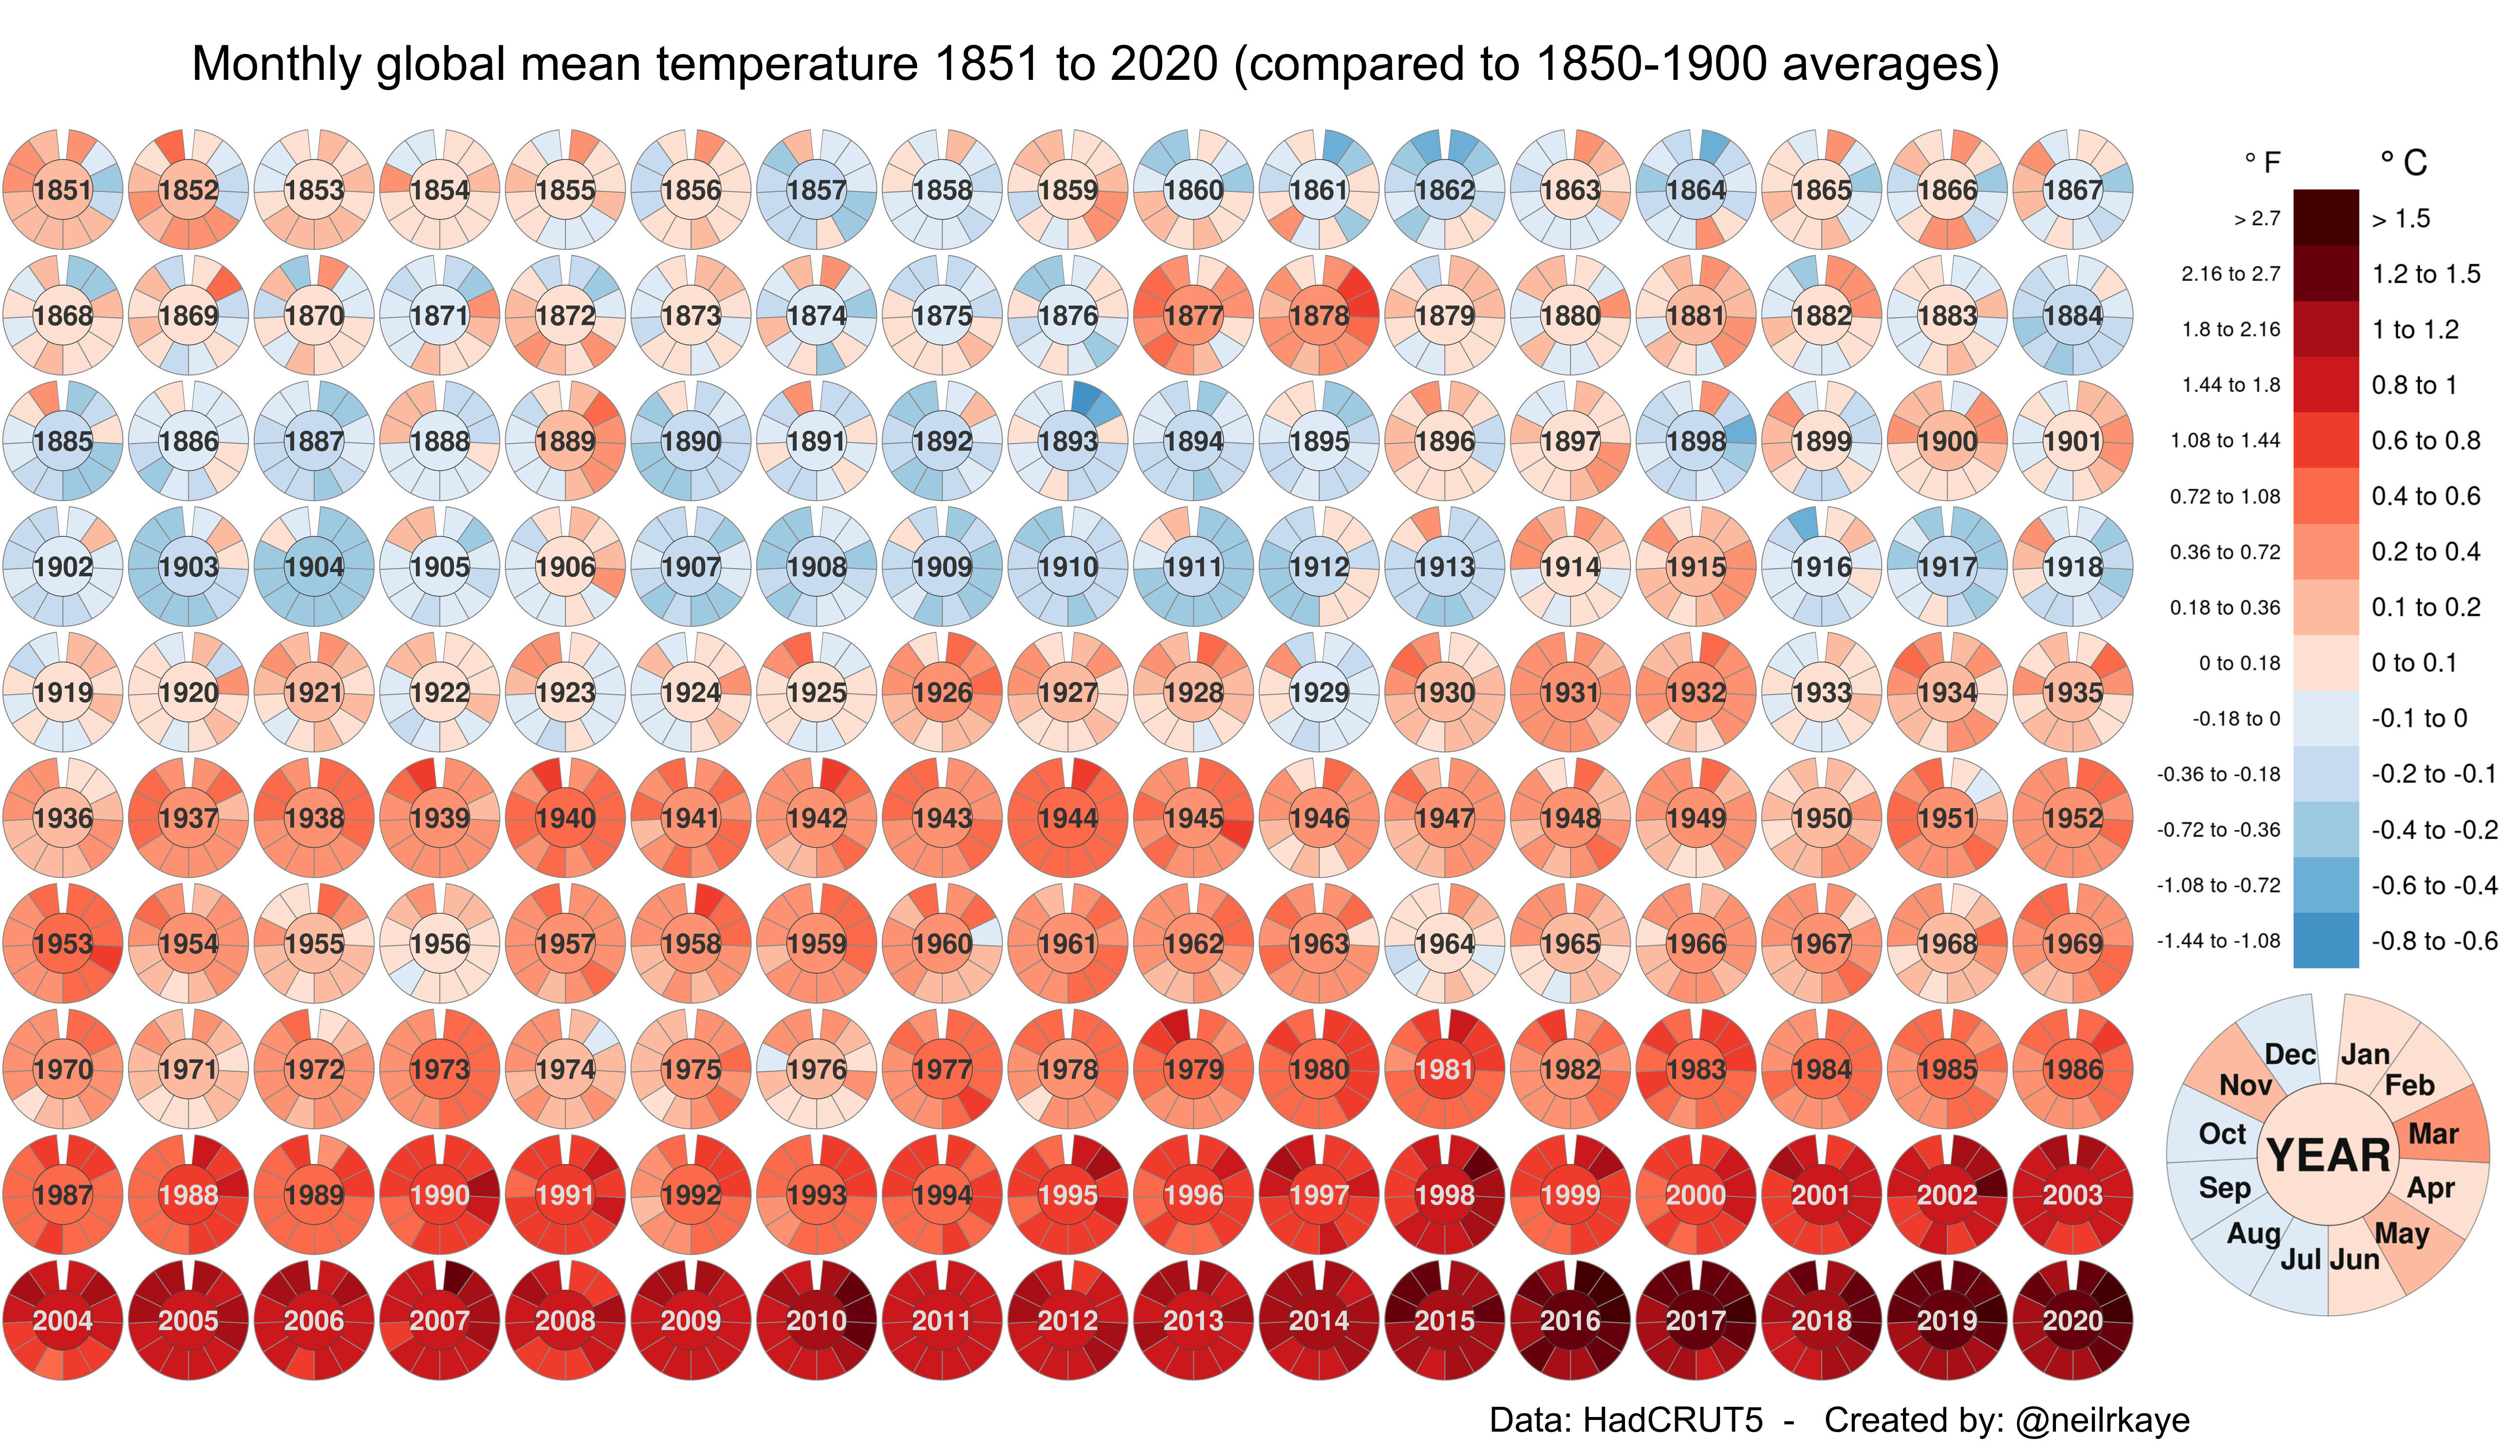
    Reducing energy consumption can have a direct and significant impact on reducing your carbon footprint. Energy consumption is a major contributor to carbon emissions, and by using less energy, you are reducing the amount of greenhouse gases that are released into the atmosphere.

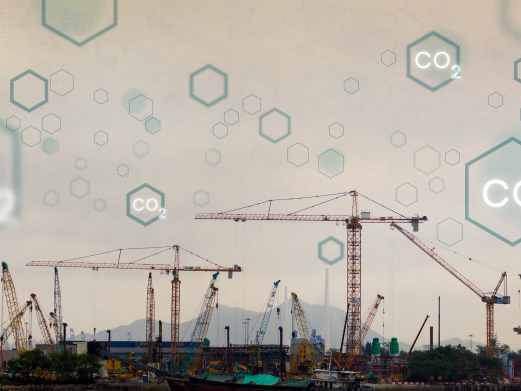
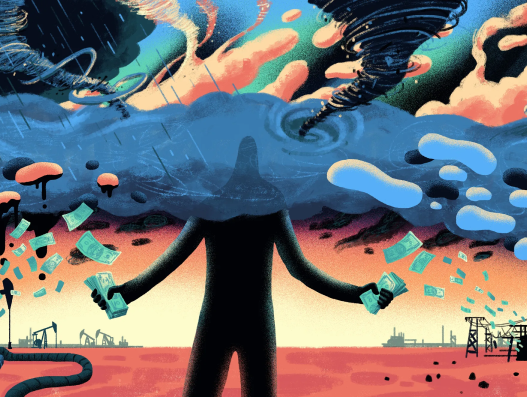
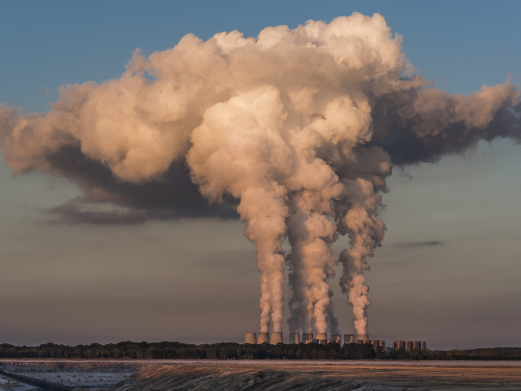
    When energy is consumed, it typically results in the burning of fossil fuels such as coal, oil, and natural gas. These fuels emit carbon dioxide and other greenhouse gases when they are burned, contributing to climate change. Therefore, by reducing the amount of energy consumed, the amount of these emissions is also reduced.

    Additionally, by reducing energy consumption, you may also be reducing your dependence on fossil fuels, and instead using more renewable energy sources, such as solar, wind or hydro power which are much cleaner and don’t emit any greenhouse gases. Furthermore, by reducing energy consumption, you can also reduce the need for new power plants and the associated infrastructure, which can also have a positive impact on the environment. Overall, reducing energy consumption is an effective way to reduce carbon footprint and help mitigate the effects of climate change.

    In conclusion, tracking your energy consumption can be a great way to save money on your energy bill in India. By understanding how much energy you are using and where you are using it, you can take steps to reduce your consumption and lower your costs. Whether you choose to use a smart meter, monitoring device, or energy tracking app, tracking your energy consumption is easy and can provide significant savings. Not just that, it also reduces your carbon footprint and helps the environment. So start tracking your energy consumption today and see how much you can save!

    Activate Windows 10

  • Make your new year celebration carbon-neutral & start it on a positive note

    Make your new year celebration carbon-neutral & start it on a positive note

    Are you going through the new year’s resolution fad?: quitting smoking, reducing alcohol, new gym membership to start workouts and up your veggie intake?
    Despite best intentions, the majority of us quickly abandon our resolutions as the new year progresses.
     
    Why not undertake a new resolution in 2023 that has planetary as well as individual benefits?
    Instead of focusing only on weight loss take a challenge to adopt a much more aware lifestyle where you can track your carbon footprint, get advice on how to reduce emissions that contribute to global warming and get opportunities to offset and attain net zero.
     
    We have many tools to manage our health, fitness, finances and many other aspects of living a simple and sustainable life, but none to manage our behavioural influence on the environment.  This lack of awareness leads to us being more taxing on the environment without realising that we are neglecting our impact.
     
    With almost 72% of carbon emission being linked to consumer behaviour, it has become important that consumer becomes aware of their impact. Myplan8 is an app-based solution which helps users automatically calculate users their carbon footprints based on their behaviour data. In addition, we have added a feature where you can evaluate your New year party’s carbon emissions for you and make the event carbon-neutral. A good way to enter and start 2023 with a zero carbon footprint. Apart from New Year bash, you can also evaluate attending or hosting a birthday party, your anniversary and weekend parties.
     
    How this one-time action can be your Kickstarter to carbon neutrality?
    While you will be excited to have a gala at any of these events every activity of it has its carbon footprint. Let’s say you had a non-veg meal and a bottle of wine you can expect a carbon footprint of 6.5 kgs per person in an event which is equivalent to half a year offsetting done by a fully grown tree. If you are hosting, multiply the impact.
    Like when you have a party, how much your travelling and knowing other aspects can help you understand the impact and allow you to offset it. A small one-time event is easier and quicker to offset. This helps you to take baby steps to fulfil your resolution in 2023.
     
    Where can I find information on how to reduce my carbon dioxide emissions?
     
    Using a questionnaire about your lifestyle choices including how often you drive or fly, what you eat, and how much electricity you use, Myplan8, a free online application, offers users an estimate of their carbon footprint using 8 categories linked to their lifestyle.
    Myplan8 compares users’ carbon footprints to global targets and provides options in each category for reducing their impact on the environment.
    These can be as simple as switching to water-saving faucets rather than regular faucets or as involved as becoming a vegetarian or switching to a green energy source.
    Users may pick and choose where to make adjustments, and then see the cumulative effect on their carbon footprint. “It’s about discovering what works for your lifestyle and your wallet.” 
     
    Why does India need to focus on carbon footprint reduction?
    To restrict global temperature rise to 1.5°C by the end of the century, a 45% decrease in anticipated 2030 greenhouse gas emissions is needed, according to a new UN assessment released today. This includes a submission from India.
    In August 2022, India changed its NDCs. The new NDC commits India to lower GDP emissions intensity by 45% by 2030 from 2005 levels. It also plans to instal 50% non-fossil fuel-based electricity by 2030. India added a healthy and sustainable lifestyle, “LIFE – Lifestyle for Environment,” to battle climate change.
    The analysis reveals that the amended NDCs will reduce India’s emissions. According to the analysis, India’s emissions won’t peak until 2030. Studies show emissions reduce substantially after peaking. According to a 2017 World Resource Institute analysis, delaying the peak will make the global temperature rise harder.
    At COP 26, Prime Minister Narendra Modi pledged net-zero emissions by 2070, 500 GW of non-fossil fuel energy capacity by 2030, 50% renewable energy, 1 billion tonnes of carbon emissions reduction, and 45% economy-wide carbon intensity reduction.
    India has encouraged the Group of 20 nations (G20) to reduce per capita greenhouse gas (GHG) emissions to the global average, so freeing up “some” carbon space for poor countries.
    The developed world is predicted to occupy 67-75% of carbon space. This is significant in the run-up to the United Nations Climate Change Conference, which will be held in Glasgow this November. In its presidency for G20 2023, India must set up an example of achieving success the same as a developing nation and show progress.
    So if we need a major impact, consumer needs to become aware of sustainable living and choices. And, the New year’s resolution and the celebration bash are a good place to start.
  • What is Carbon Footprint (Co2 emission)?

    What is Carbon Footprint (Co2 emission)?

    “Carbon footprint” refers to the total amount of carbon dioxide (CO2) emissions produced by an individual or organisation (e.g., building, corporation, country, etc.). It factors in both direct and indirect emissions, the former coming from the burning of fossil fuels in production, heating, and transportation and the latter from the generation of electricity, which is then used in the production of the goods and services that consumers purchase. Beyond carbon dioxide, other greenhouse gases like methane, nitrous oxide, and chlorofluorocarbons are often included in discussions of a “carbon footprint” (CFCs).

    Ecological footprints were first proposed in the early 1990s by Canadian ecologist William Rees and Swiss-born regional planner Mathis Wackernagel at the University of British Columbia. It was from the idea of an ecological footprint that the concept of a carbon footprint grew. An ecological footprint is the total area of land needed to sustain a given population or activity. Considerable quantities of both water and land are required for food production. Conversely, a carbon footprint is typically presented as a weight, such as tonnes of CO2 or CO2 equivalents produced annually.

    How has the historical pattern of carbon dioxide (CO2) emissions changed around the world?

    From the middle of the 18th century to the present day, global emissions are shown to have steadily increased.

    We can see that emissions were significantly lower before the Industrial Revolution. Up until the middle of the twentieth century, emissions growth was slow. In 1950, human activity caused global CO2 emissions of 6 billion tonnes.

    More than 22 billion metric tonnes were produced by 1990, more than four times as much as in 1970. There has been a rapid increase in emissions, and we now produce more than 34 billion tonnes of pollution annually.

    While emissions growth has slowed in recent years, they have not yet reached their maximum level.

    We can see how the carbon emission has region-wise in last few decades. Europe and the United States dominated global emissions until the late twentieth century. From 1900 to 1950, Europe and the United States accounted for over 85% of annual emissions; by 2000, that number had only slightly decreased.

    Recent decades, however, have seen a dramatic shift in this regard.

    As the 20th century progressed, the rest of the world saw a dramatic increase in its emissions, especially in Asia and, most notably, China.

    Only about a third of emissions come from the United States and Europe.

    Which country or region produces the most CO2 annually per capita?

    When we divide a country’s total emissions by its population, we get an estimate of what each country’s citizen of that country contributes. This gives us an estimate of CO2 output per person.

    The said analysis focuses on emissions generated within national borders, independent of international trade in goods. What happens to these numbers when we factor in international trade is the subject of much larger discussion basis the consumption-based emissions. Production numbers matter because they are used to set climate goals. Thanks and thanks to historical reconstructions, we have global production data for the entire planet dating back to the middle of the 18th century.

    Emissions per person vary significantly from one region of the world to another.

    Major oil producers are also among the world’s highest per capita CO2 emitters, especially those with small populations. They are primarily located in the Middle East: With 49 tonnes (t) per capita emissions in 2017, Qatar ranked first, followed by Trinidad and Tobago (30 t), Kuwait (25 t), the United Arab Emirates (25 t), Brunei (24 t), Bahrain (23 t), and Saudi Arabia (19t).

    To counteract this, many of the world’s top oil producers have small populations and thus low total annual emissions. The United States, Australia, and Canada are all highly populated countries with correspondingly high levels of total emissions due to their high per capita emissions. Australia has the largest average footprint, at 17 tonnes per person, followed by the United States (16.2 tonnes) and Canada (15.6 tonnes).

    The 2017 worldwide average was only 4.8 tonnes per person, which is more than three times higher than that. It stands to reason that countries with high standards of living also have a large carbon footprint, as there is a strong correlation between GDP and CO2 emissions per person. It becomes apparent, however, that countries with similar living standards can have vastly different per capita emissions. Numerous European countries, for instance, produce fewer greenhouse gas emissions than either the United States or Canada.

    The emissions of some European countries are not too far above the global average: There were 5.3 tonnes of emissions per person in Portugal in 2017, 5.5 tonnes in France, and 5.8 tonnes in the United Kingdom. This is considerably less than the sums spent on a similar lifestyle in neighbouring countries like Germany, the Netherlands, or Belgium. The electricity mix varies widely from country to country, depending on factors such as the share of electricity generated by nuclear and renewable sources. As a result, fossil fuels generated caused a much smaller percentage of electricity; in 2015, only 6% of France’s electricity came from fossil fuels, while that percentage was 55% in Germany.

    Clearly, policy and technological decisions make a difference, but prosperity is still the primary driver of CO2 emissions.

    There are still many countries with relatively low CO2 emissions per person. The annual average footprint is around 0.1 tonnes in many of the poorest countries in Sub-Saharan Africa, including Chad, Niger, and the Central African Republic. Compared to the United States, Australia, and Canada, that is over 160 times lower. It takes a Malian or Nigerien a whole year to equal what the average American or Australian emits in just 2.3 days. India’s average carbon footprint is 2.8 tonnes.

    Think about this:

    One of the significant aspects of carbon emission in today’s digitally evolved world is the average usage of technology by the country’s population of each count. With the rise of 5G data and smartphones in every remote area of the world, carbon emission has increased. It is we who need to understand development comes at a cost, and we must create harmony while we soring high the waves of development.

    It is possible to neutralise carbon and create a much more harmonious world by evaluating and understanding the impact of carbon emissions on an individual level. If we all do our part, the world we leave for future generations will be much better than the one we inherited.

  • Why is offsetting necessary to create a better world?

    Why is offsetting necessary to create a better world?

    Carbon, carbon everywhere, are we waiting for the day when there will be no clean air?

    The global effort to reduce emissions of greenhouse gases (GHGs) and mitigate warming and climate change includes measures to reduce carbon dioxide (CO2) emissions. Even if reducing emissions of other greenhouse gases like methane is vital, reducing carbon dioxide emissions is the essential thing that can be done to address climate change.

    Myplan8 is working hard to develop the infrastructure needed to make it easy for individuals to offset their carbon emissions transparent and verifiable. Nonetheless, how efficient are these carbon offsets? In this article, we’ll go into greater detail about carbon offsetting, explaining what it is and how it can help reduce your carbon footprint.

    What is carbon offsetting?

    Carbon offsetting involves compensating a third party for your own greenhouse gas emissions by paying them to remove an equivalent amount of carbon dioxide and other gases from the atmosphere. This is reported in terms of carbon dioxide (CO2e) equivalents because CO2 is the most prevalent greenhouse gas.

    Carbon offsetting can be done for a single action, like taking a flight, or for an organization’s entire set of actions. Carbon credits, which are generated when carbon capture technologies successfully remove CO2 from the air, are the primary tool for offsetting. People and organisations can become carbon neutral if they purchase emission offsets to make up for their own emissions. A carbon credit’s associated carbon must be retired after it is purchased. Retirement of credits implies that the offsets linked with them cannot be counted again, which eliminates the possibility of double counting credits and ensures that emissions reductions are more accurately reflected.

    Compliance carbon market participants must use verified emission reductions (VERs), while voluntary carbon market participants use certified emission reductions (CERs) (CERs). Cap-and-trade systems, which feature their own compliance market, primarily target larger, carbon-intensive businesses and sectors. To avoid exceeding a government-mandated cap on emissions, businesses in this market must purchase carbon offsets.

    It is the companies in the voluntary market that have chosen to offset their carbon emissions in an entirely voluntary manner. The meteoric growth of this industry over the past few years can be directly attributed to investor demand to only invest in companies with strong emissions reductions plans and other favourable ESG (environmental, social, and governance) criteria in place.

    The amount of carbon dioxide (CO2) that has been kept out of the air is commonly quantified in terms of kilogrammes or metric tonnes when discussing carbon offsets.

    Can carbon offsetting help us meet our emission reduction goals?

    Carbon offsetting works if it leads to a net decrease in atmospheric carbon, as would occur if polluting activities in one region were to reduce their carbon emissions. To counteract the emissions, you designate in your purchase, you must use carbon offsets that capture a verifiable amount of carbon.

    Although this is a commendable strategy, it shouldn’t make up all your climate change mitigation efforts. Source reductions are necessary to achieve net-zero emissions, which is preferable to carbon neutrality from an environmental perspective.

    Where Can I Find Some Good Cases of Carbon Offsets?

    Tree planting is a standard method of creating carbon offsets because trees can absorb and store carbon dioxide. Although this is not the only way to counteract carbon output, it is the most popular and effective approach at the moment.

    The most well-known approaches to carbon offsetting involve tree planting and other forms of restorative forestry, but there are other possibilities. Methods currently in use for capturing carbon include direct capture from CO2 emitted by fossil fuels, capture and storage of CO2 and other GHGs that seep out of landfills, and renewable energy projects (or clean energy projects) that create carbon credits. Rather than destroying forests and the carbon they store, a new method of offsetting allows them to remain uncut. The local communities that rely on the forest for their livelihoods benefit from this, and the forest’s biodiversity is preserved.

    How can you tell if offsetting is effectively reducing your carbon footprint?

    If you want to make a severe dent in the amount of carbon pollution you are personally responsible for, offsetting your emissions with a reputable organisation is a must. Most offset programmes can be relied upon, including Terrapass’ offsetting based on personal carbon offset calculations. It will help if you determine which option best suits your needs. High-quality Offsets are more likely to come from programmes that third-party auditors have verified according to the Gold Standard or Verra VCS standards.

    Is It Possible to Neutralize My Carbon Footprint?

    Depending on your lifestyle, where you live, and your level of self-awareness, you may be able to offset your carbon footprint. Because your existence contributes to worldwide indirect (and probably direct) emissions, reaching carbon neutrality without offsetting your footprint is exceedingly tricky. CO2 is produced and released whenever an elevator is used in a high-rise building, or a meal is cooked on the street. Knowing how much carbon your lifestyle generates and how much you can offset is essential for reaching net-zero emissions.

    The less pollution you produce, the less effort will be needed to counteract it. The larger your carbon footprint, the more offsets you’ll need to compensate for your increased emissions.

    Myplan8’s new app will be able to provide some of the best and easy offsetting projects for you neutralise your impact on the planet.

    Think about this:

    If we plant enough trees, We can offset our carbon dioxide emissions.

    There are many variables that affect how many trees are needed to offset the effects of a ton of carbon footprint, such as the type of tree planted, the conditions in which it grows, the age of the tree, and so on. Myplan8’s data shows that you can offset 1 ton (i.e, 1,000 kgs) of your annual carbon emission by planting approximately 73 trees (i.e palm tree, 1361 kg, offset in 100 years, as we said the number will vary with the type of native tree). With the new Myplan8 app, you’ll be able to figure out exactly how much carbon you’re emitting and find an offsetting project to help you nuetralise it out.

  • What are the 8 main carbon footprint categories?

    What are the 8 main carbon footprint categories?

    If you think that the traditional – Roti, Kapda, aur Makaan is the only reason for your carbon footprint, you are in for a surprise!

    In the past two decades, things like ever-increasing purchases, internet discounts, repeat transactions, free data, and more have become standard fare. Let’s look at the eight factors that make up your carbon footprint.


    Home-Water: Water is used in many of the products we consume and utilise regularly. The average individual needs 5 litres of water daily to function in a calm atmosphere with light activity—the average American drinks between 100 and 175 gallons of water daily. Globally, we consume around 4 trillion cubic metres of fresh water yearly. On average, we use 25 litres to 50 litres for bathing.

    Home-Electricity: Have you ever looked at the actual units for the electricity and gas you use? It matters what kind of light bulb you use, what type of stove you have, and what kind of rating all your fancy appliances have. Here’s an interesting data point: Annual CO2 emissions from a single incandescent light bulb average 4,500 pounds. LED bulbs emit more than 1,051 pounds per hour, while CFLs emit less than 1,051.


    Food Habits: Fewer than one-third of Indians (and an even more significant proportion of low-income families) know that their food choices account for 10–30% of their carbon footprints. The majority of food-related emissions happen during production (68%).  In comparison, the carbon footprints of foods, including fruit, vegetables, legumes, and nuts, are much smaller. You can drastically reduce your carbon footprint by eliminating or reducing meat from your diet. Foods like this have the most carbon footprint.


    Waste management: Methane is produced through the anaerobic decay of trash in landfills, while nitrous oxide is released when we burn trash. Both of these contribute directly to greenhouse gas emissions.

    With only a third of the world’s food wasted, 3 billion people could be fed. According to a recent study, the average Indian throws away 137 grammes of food per day. That works up to 50 pounds yearly or 0.96 kilogrammes per week. India loses about Rs 92,000,000,000 annually due to the wasted 40% of its food supply. Reducing greenhouse gas emissions and conserving energy are two ways in which waste reduction and recycling contribute to combating climate change on a global scale.


    Mode of transportation: Do you prefer driving your car, even if just for a short distance, over walking or riding a bike? Hence, it is imperative that you read this information. The road sector, including both passenger and freight vehicles, is responsible for more than 92% of all transportation emissions. It also contributes significantly to the smog problem in India. The Center for the Study of Science, Technology, and Policy (CSTEP) used the Sustainable Alternative Futures for India (SAFARI) model to predict that in 2022, India’s transportation sector would be responsible for 375 million tonsof direct carbon dioxide emissions (Mt CO 2), or roughly 10% of India’s total greenhouse gas (GHG) emissions. Roads account for over 90%, followed by air and then rail (see Figure 1 for the break-up). By 2050, transportation-related emissions in India will have increased by more than three times, with the aviation sector responsible for a growing share of those emissions.


    Pets: To what extent do you like felines over canines? Among pet owners, these are the most popular choices. According to Sceince Focus, a medium-sized dog is estimated to release 770 kgs of CO2e yearly, while a medium-sized cat releases only 310 kgs. If you’re talking about a bigger barker, the number jumps up to 2,500 kgs. What cats and dogs consume in a year is the same as the carbon emissions from 13.6 million cars for a year.

    Shopping & Lifestyle: According to our calculation reflects that the average urban buyer can generates about 1,620 kgs of carbon dioxide yearly. Most buyers think it’s essential to find a way to showcase one’s individuality through one’s wardrobe. Companies and consumers alike will need to make modifications if we’re going to do a U-turn.

    This concept is gaining traction since most consumers are eager to make better purchasing decisions but lack the knowledge to do so. 


    Digital usage: According to a 2019 research by Satistica, roughly 4.1 billion people throughout the world have access to the Internet. By the billions, people are conducting searches, streaming videos, and using various forms of cloud computing, all of which contribute to the world’s insatiable appetite for energy and, by extension, to CO2 emissions. Their estimated share of world CO2 emissions ranges from 2.3% to 3.7%, depending on the study. This is equivalent to the emissions made by the entire aircraft industry. Individuals are more likely to arrive at a correct estimate of the volume of CO2 emissions and the ease with which they can be reduced. The introduction of 5G in India has been met with widespread enthusiasm. Because we are a developing nation, we must advance. Compared to 4G users, 5G users can use up to 2.7 times as much mobile data. Fifth-generation mobile networks (5G) make possible significantly higher average speeds than 4G and add a considerable amount of new capacity.


    We bet all this never crossed your mind…


    Calculating your carbon footprint is the first step toward minimising your environmental impact. If you find reducing carbon emissions challenging, you can use offsets to neutralise your footprint and achieve net zero. Myplan8’s proprietary calculator can help you track, reduce and offset your carbon footprint. A release date for the app will be announced soon.

    Think about this:

    Due to 5G, the video quality will improve.

    Let’s see some calculation:

    Streaming videos use 304,920 GWh per year.
    1 hr of video streaming: 1080p: ~1.9 to 2.55 GB/hr 4K:~3.5-7 GB/hr
    Energy intensity:4.94 kWh/GB
    Carbon Footprint: 0.0007tn
    Finding: Watching 1hr of 4K video produces 280.26 g of CO2
    5G user: 2.7x times = 756.70 g CO2

    Users of YouTube & Netflix will detect higher throughput, so they will automatically have higher data usage. People will change phones for higher output.

    Longer time will be spent on the phone, increasing screen time and creating health concerns. Myplan is about to launch India’s first carbon calculator including your digital behaviour.

  • 6 Companies working towards the ‘Carbon-free Economy’ for the future

    6 Companies working towards the ‘Carbon-free Economy’ for the future

    More and more of the world’s largest corporations are taking action to combat climate change and provide the groundwork for future net-zero carbon economies. They are making the most of the opportunity to accelerate innovation, strengthen competitiveness, enhance risk management, and accelerate growth.

    Below are a few examples of companies that have set ambitious targets for reducing their environmental impact. 

    Unilever only operates on sustainable energy sources throughout all five continents.

    One of the largest fast-moving consumer goods firms in the world, Unilever, which provides products to approximately 2.5 billion people every day, reported in September, 2019 that it had achieved substantial progress toward its targets for using renewable energy.

    The company’s operations are powered entirely by renewable grid electricity on all five continents. Not only does this demonstrate progress toward its objective of using 100% renewable electricity with RE100, but it also demonstrates progress toward its ultimate aim of being carbon positive by 2030.

    Unilever has funded energy-efficiency initiatives to achieve this. This has led to a 28% decrease in overall energy consumption and a 50% reduction in carbon emissions per tonne since 2008. The declaration came just days before Unilever joins other business and government leaders at the UN Secretary General’s Climate Action Summit held in September of 2019, to discuss the critical need to keep the average global temperature rise below 1.5°C, marking the official start of Climate Week NYC, 2019

    The corporation is attempting to hasten the transition to electric vehicles through EV100 and other initiatives.

    Mahindra: Making progress toward ambitious objectives

    Anand Mahindra, chairman of the Mahindra Group, issued a call to action for companies worldwide to commit to a science-based emission reduction objective at the start of 2018. (SBT).

    He followed up on his rousing call to action by saying he would establish SBTs for each company in the $20.7 billion Indian conglomerate and work toward making the entire group carbon-neutral by 2040. Twenty member firms have committed to using SBTs as part of the group’s Science Based Targets project.

    The two Mahindra enterprises responsible for the most greenhouse gas emissions, Tech Mahindra and Mahindra Sanyo Special Steel, were the pioneers in committing to and obtaining approval for SBTs, with Sanyo Steel becoming the first steel manufacturer in the world to do so.

    The team is making headway in its mission. Company-wide emissions decreased by 14% over the fiscal year 2017-18, totalling 618,439 t CO2 across direct, indirect, and value chain emissions (Scopes 1, 2, and 3). The $419 million in annual revenue generated by the company’s “green” companies demonstrates that addressing climate change does not have to compromise profit margins.

    IKEA: Quickening the Pace of Climate Change

    IKEA’s parent company, INGKA Group, is making more strides toward achieving a climate-positive value chain by 2030, even as the IKEA brand continues to expand. This involves achieving its scientific goals, such as moving to 100% renewable electricity by 2025 (RE100) and 100% zero-emission home delivery by 2030 (EV100).

    IKEA is making progress toward its aim in the area of renewable energy. IKEA sourced 81% of the energy it consumed throughout its 2018 fiscal year from renewable resources. In 2021 IKEA announced a new programme in India, Poland and China that supports nearly 1,600 direct suppliers to switch to 100 per cent renewable electricity.

    In 2019, only one year after it was first stated, the target was met in Shanghai. Recently, IKEA stores in India, China, Australia, and France have all begun using electric vehicles.

    Levi’s: Ahead of schedule

    The first of Levi Strauss & Co.’s goals was to reduce emissions by 25 per cent by 2020, and the company has already accomplished this. In light of these gains, the firm has committed to cutting GHG emissions by 90% inside its operations and 40% throughout its worldwide supplier chain by 2025. Also, they’re committed to making the change to renewable energy.

    Company employees are working to ensure that all of the company’s electricity comes from renewable sources by cutting energy waste, installing solar panels at locations around the world, purchasing green utility products in Europe, entering into power purchase agreements (PPAs) in the United States, and purchasing renewable energy certificates (RECs) in various countries.

    An interesting data: by the end of 2017, Levi’s had helped six of its suppliers in Bangladesh, India, Sri Lanka, and Vietnam reduce their greenhouse gas emissions by 13% and their energy use by 22%. These initiatives saved manufacturers over a million dollars in operational costs while reducing their carbon footprints. GlobeScan is doing a market study in 2021 and Levi’s is taking part in it in Brazil, China, France, India, South Africa, the United Kingdom, and the United States. The study’s goal is to learn how individuals place a monetary value on nature, and its outcomes will shed light on regional perspectives on nature and the role of corporations in its protection. In the long run, it hopes to apply what it has learned to get people invested in helping to protect biodiversity.

    Maersk: Revolutionizing the Shipping Industry

    The world’s largest shipping container firm, Maersk, has challenged its competitors and suppliers by committing to carbon neutrality by 2040. It supports this lofty objective by focusing on the ships and fuels important to international shipping. 

    In order to meet this goal, Maersk Ocean has established a policy of only buying newly built vessels that can be operated on green fuels, and has pledged to reduce emissions per transported container in its fleet by 50% by 2020. By modifying the dimensions of the hull and the ship’s motion, Maersk has created dishes that are 15 per cent more efficient than standard vessels.

    Since 2007, Maersk has reduced its CO2 emissions per container by 46%, which is 9% greater than the industry average.

    Rolls-Royce’s Vision for a Carbon-Free Future

    Rolls-Royce is applying its superior engineering prowess and extensive hybrid and electric power background to the world’s most pressing technological issue. The corporation is at the forefront of the movement to electrify aviation, and its inventions in the rail, marine, and power sectors have set the standard for the industry.

    Rolls-Royce wants to drastically cut down its greenhouse gas (GHG) emissions from its activities and facilities by 2030. Rolls-Royce has reduced its greenhouse gas emissions by 21% since 2014, its energy use by 20% and its rubbish output by 67%.

    However, because of Rolls- Royce’s contribution to the field, commercial flights are 40% more efficient than the first generation of gas turbine aero engines. Both the Trent XWB, which propels the Airbus A35, and the new Pearl 15 engine for business aircraft include ultra-low emissions combustion systems, resulting in a 7% increase in fuel efficiency and the best NOx emissions in their respective categories.

    Zero-sum cloud computing, courtesy of Salesforce

    Salesforce.com, Inc., an American cloud-based software corporation with a market cap of over $122 billion, ranked second on Barron’s 2018 list of the 100 Most Sustainable Companies. Through emission reductions and offsetting, the company achieved its objective of net-zero emissions in 2018.

    The corporation has also committed to obtaining all of its electricity needs for its global operations from renewable sources by 2022 through RE100. It has also committed to only owning and working in buildings with net-zero carbon emissions by 2030 as part of the EP100 initiative’s Net Zero Carbon Buildings roadmap.

    For its part, Salesforce is helping its top suppliers—responsible for half of its total emissions from suppliers—establish their reduction targets for 2025.

    These companies are merely the tip of the iceberg of those hastening the transition to a carbon-free economy. More than a thousand corporations have committed to making significant efforts to combat climate change.

    Think about this:

    Annually, India generates 2.88 Gt of CO2 through its activities.

    141 crores, or nearly 493 million people, out of India’s total population of 142 crores live in urban regions (about 35 percent of the total).

    The average urban Indian generates 1.32 tons of carbon dioxide over the course of a year.

    The 493 million people who live in metropolitan areas in India are responsible for the production of 650 million tons (about 22 percent of the total) of CO2. 

  • This 1920s Inventor Sped Up Climate Change With His Inventions

    This 1920s Inventor Sped Up Climate Change With His Inventions

    While many technologies have helped people and advanced society, others once hailed as breakthroughs today have detrimental implications. Once-wonderful insecticide DDT had far-reaching harmful consequences on the ecosystem, as did plastic packaging. Two innovations—leaded gasoline and chlorofluorocarbons—cause the most harm (to human and planetary health) (CFCs). 

    Thomas Midgley Jr., a chemical engineer from Beaver Falls, Pennsylvania, who wore glasses, invented both.

    Low-quality gasoline at the turn of the century caused engines to knock, reducing performance and economy and often causing mechanical failure. In 1916, Charles Kettering, inventor of the electric starter, asked Thomas Midgley to produce a gasoline additive that would boost car engine performance. Midgley opted for ethanol after many fruitless efforts (the same ethyl alcohol found in wines and spirits). Midgley patented an alcohol-gasoline anti-knock fuel in 1920.

    Midgley and Kettering hailed ethanol as the “fuel of the future,” but they couldn’t patent the technique and couldn’t profit from it. Prohibition made it easier for farmers to produce ethanol from corn, which increased home distillation. Further, ethanol’s dual purpose as a fuel source made it unpalatable to the oil business, whose support the embryonic automakers sector needed.

    The dark discovery by Midgley

    Midgley and Kettering had moved on to General Motors by this time, and Alfred P. Sloan (often called the “father of planned obsolescence”) had abandoned their attempt to sell gasoline mixed with ethanol in 1921. Sloan’s plan to fight Ford’s Model-T comprised flashier cars with more powerful engines, but engine knock remained a problem. GM sent Midgley back to the lab to build a cheap, profitable gasoline additive.

    The first in the US to include lead was ethyl-branded gasoline. BEV Norton’s fault. The first leaded gasoline in the US was called “Ethyl.” To Norton’s credit Midgley discovered tetraethyl lead in December 1921. (TEL). Karl Jacob Löwig developed TEL in 1853, but Midgley discovered that adding it to gasoline prevents engine banging when a cool flame burns fuel too early. TEL disturbs this process, allowing combustion to occur at the correct time, and enhancing engine compression, speed and fuel economy. TEL was inexpensive to develop and could be trademarked, opening the door to significant income for GM.

    Due to the detrimental health effects of lead, the word “lead” was never used when the first leaded gasoline was introduced in Dayton (Ohio, USA) in February 1923 under the brand name “Ethyl.” This name evoked discarded ethanol.

    First TEL deaths

    Midgley was vice president of the Ethyl Corporation, a collaboration between GM and Standard Oil (now Exxon) that commissioned Dupont to produce “Ethyl fluid” (essentially TEL plus red dye). Despite the company’s assertion that TEL was safe, numerous states outlawed it after hundreds of workers hallucinated, went insane, and died at a new New Jersey factory.

    Midgley held a press conference in 1924 to tout the TEL’s safety. Source: Wikipedia Midgley praised TEL’s security in 1924. Wikipedia photos

    After recovering from lead poisoning in 1923, Midgley participated in a press briefing on 30 October 1924 to illustrate TEL’s safety. He then rubbed TEL into his hands and inhaled its fumes for 60 seconds in front of the journalists, insisting he would be OK doing this every day and blaming the illness on staff who hadn’t followed safety rules. Midgley knew TEL was toxic. In 1922, DuPont’s chairman described it as a “colourless liquid with a sweetish odour that causes lead poisoning swiftly if absorbed through the skin.”

    Midgley ignored TEL’s risks for its financial benefits. According to his 1925 scientific conference presentation, “tetraethyl lead is the only known material that can achieve these [anti-knock] findings, which are important to the economical use of all automotive equipment by the general population.” He didn’t say he’d altered his view regarding ethanol as an anti-knock component since it burns cleanly.

    Health consequences

    Large corporations convinced the US Surgeon General that the health dangers of lead-tainted gas were insignificant compared to the economic benefits. By 1936, 90% of U.S. gasoline contained ethyl fluid, having quickly surmounted regulatory barriers from states and health agencies. Leaded gasoline became standard globally in later decades. In 2000, Mexico City’s four million cars produced 32 metric tonnes of lead daily.

    People stopped using lead-tainted gasoline in the early 21st century. CC-licensed photo (CC0) Most industrialised nations eliminated leaded gasoline by the early 2000s. Pixabay’s public-domain image.

    Leaded gasoline was a public health hazard. Lead has no physiological use and harms the kidneys and nervous system. It can cause children to lose their IQ and become more aggressive and impulsive. Research links childhood lead exposure to violent criminality.

    In the 1980s, the U.S. began phasing out leaded gasoline as Americans learned of its health risks (only Algeria continues to use leaded petrol today). Due to the widespread usage of leaded gasoline for nearly a century, the metal is now embedded in the planet’s surface, atmosphere, water supply, and human bodies. According to a 1992 research in The New England Journal of Medicine, modern people have 625 times more lead in their skeletons than pre-Columbian North Americans. Leaded gasoline causes 90% of lead poisoning in poor children, according to the WHO. 15 to 18 million youngsters suffer chronic brain damage.

    Discover of Freon

    Thomas Midgley’s next great innovation addressed a problem with General Motors refrigerators of the 1920s. This equipment sometimes emits corrosive gases like sulphur dioxide or methyl formate (highly toxic if inhaled and flammable).

    Under Midgley’s leadership, scientists invented dichlorodifluoromethane, the first chlorofluorocarbon (CFC), a non-toxic, non-flammable refrigerant commercialised Freon-12. Midgley blew out a candle after inhaling the gas to show the American Chemical Society its effectiveness.

    Midgley’s next concept was to fix refrigerators. James Vaughan Midgley’s second invention was refrigerators. Chlorofluorocarbons were first synthesised in 1939 and immediately became used as refrigerants, aerosol propellants, and solvents. Midgley didn’t realise that these gases would blast a hole in Earth’s ozone layer, which absorbs cancer-causing UV light. Even though the CFC-caused gap has stabilised, the situation is still worrying and will take decades to repair.

    Think about this:

    Midgley can be forgiven for the CFC debacle, but tetraethyl lead’s dangers were immediately apparent. Thomas Midgley was honoured for his two discoveries and 170 patents, including ethyl gasoline. Midgley was paralysed by polio in 1940. He was an innovator. Therefore, he let others help him move using ropes and pullies he built. He was strangled to death on November 2, 1944, at age 55. His final idea only injured him, unlike his first two, which were global.

  • Since 1850, these significant moments in history have hastened the shift in climate.

    Since 1850, these significant moments in history have hastened the shift in climate.

    Here’s a Graph Showing the Temperatures Around the World (1851-2020)

    Since the beginning of the industrial revolution, surface-level average temperatures have been more than 1.5 degrees Celsius higher than their pre-industrial values. Image: “The Visual Capitalist” (photograph)

    Temperatures at the earth’s surface have risen at an average rate of 0.07 degrees Celsius (0.13 degrees Fahrenheit) every decade for the past 130 years since 1880. Although each component may not appear to be particularly significant on its own, the total will, over time, become increasingly important.

    Temperature swings have been more extreme over time, with the rate having more than doubled to 0.18 degrees Celsius (0.32 degrees Fahrenheit) since 1981. The environmental catastrophes that have arisen as a direct result of the ongoing process of global warming have emerged as the primary dangers that humanity is currently confronted with.

    Neil R. Kaye, a climate data scientist, developed this graph to illustrate the average monthly temperatures across the globe over the past approximately 170 years. Temperature measurements have been compared to the pre-industrial averages, which have been utilised as a reference point (1850–1900).

    Why is the temperature of the globe increasing?

    The representation of the data is divided into two sections, and each of these parts indicates a significant turning point in the trend of global warming:

    1. Convergence with the Age of Machines, 1851–1935 [1851–1935]
      The predicted increase in average global temperature might range anywhere from -0.4°C to +0.6°C.
    2. Convergence with the Emerging Industrial Age, 1936–2020
      Temperature increase over the globe, from the low end to the high end: +0.6°C to +1.5°C and up

    According to the graph that displays global temperatures, the global average surface temperature has been consistently more than 1.5 degrees Celsius higher than its pre-industrial levels for several years. Let’s investigate these periods in greater depth to understand this incident’s historical context better.

    Alterations and progress made in the manufacturing sector between the years 1851 and 1935

    There is a remarkable optical abnormality that occurs between the years 1877 and 1878, and it merits more examination. This historical period witnessed a series of extreme climate events that had never happened before in the history of humanity. These events ranged from a strong El Nio to widespread droughts. The Great Famine was responsible for the deaths of between 19 and 50 million people, making it more lethal than even the pandemics with the highest death toll in recorded history.

    The first five rows of the graph depicting global temperature, several different economies began the Second Industrial Revolution (1870–1914). This was followed by World War I in the sixth row (1914-1918). Over the past eighty years, a strong emphasis was placed on the manufacturing of steel and mass-produced consumer goods.

    These technological advancements undoubtedly benefited society; however, they came at the expense of burning fossil fuels, which led to a significant increase in the concentration of carbon dioxide and other greenhouse gases in the atmosphere. This trade-off had to be made to fund these technological advances. It would be decades before scientists fully comprehend the implications of their accumulation in the atmosphere and the connection between that and a general global rise in temperature.

    The world from the 1930s up until the 2020s, often known as the Red Zone

    The second section of the temperature graph for the world shows the effects of World War II (1939-1945), which can be seen in the third column. As soon as the haze had cleared, countries immediately began the process of rebuilding, and the Third Industrial Revolution kicked the recovery into high gear.

    People and things have travelled further than ever since the 1950s, roughly concurrent with the beginning of the modern era of globalisation and commercialisation. In addition, between the years 1965 and 1970, the annual population growth rate averaged a staggering 2.1%. The pace of industrialisation began to quicken as a response to the growing demands of the contemporary world and the ever-increasing population worldwide.

    The relevance of past temperature patterns to current conditions

    The effects of climate change have been felt throughout human history. The progression of historical trends can shed light on the question of how much of the recent rapid increase in global average temperatures during the past 85 years may be related to natural patterns of climate change as opposed to activities carried out by humans.

    A member of Reddit named bgregory98 developed the following graph using a big data set published in Nature Geoscience to more vividly the argument. The rise in global temperatures has received much attention over the past two thousand years. Within this broad time frame, the most recent decade alone is responsible for producing eight of the top ten warmest years on record.

    This graph demonstrates that there has been a significant increase in average world temperature over the past two thousand years.

    Image: “The Visual Capitalist” (photograph)

    Global warming and climate change are two essential megatrends expected to emerge shortly. However, promising steps are being taken, such as the United States rejoining the Paris Climate Agreement and the reduction of global carbon emissions being designated a prominent topic at the World Economic Forum’s Davos Summit 2021. Both of these events will take place in 2021.

    Think about this:

    Climate change is hurting human life, urban areas, and ecological systems. As a result of human-caused global warming, extreme weather, ranging from heatwaves and droughts to cyclones and floods, is becoming more common, severe, and unpredictable. Because of ocean warming and acidification, coral bleaching events occur twice as frequently as in 1980, and many corals are dying as a result—the more dangerous the climate, the greater the threat to ecosystems and human societies. Even 1.5°C of global warming will make it difficult for the planet to survive. However, the 1.5°C to 2°C warming range is a critical battleground in which threats to human civilisation and ecosystems multiply rapidly.

    To progress, we must accept that we will need to make significant changes to our way of life. Transitioning will be difficult, but it is necessary to protect future generations and our species and natural environments. There is far too much at stake to wait until next year to act.

  • Two inventions you can’t live without are responsible for ozone depletion

    Two inventions you can’t live without are responsible for ozone depletion

    Have you heard that the refrigerants used in air conditioners and refrigerators can harm the natural world? Both chlorofluorocarbons (CFCs) and other refrigerants are recognised as harmful to the ozone layer, and some of them also significantly impact greenhouse gases.

    Unfortunately, the development of refrigerants has not been an event free of debate. The greenhouse impact caused by driving your car for six months is comparable to that caused by one kilogramme of refrigerant R410a. Consequently, India exercises stringent control over the entry of artificial greenhouse gases and completely prohibits the importation of gases such as CFCs.

    Refrigerants can be released into the air due to malfunctioning equipment, improper maintenance, or disposal. Be careful to choose only highly trained and experienced service professionals: When working with refrigerants, a licenced technician will know how to do it with the most negligible negative impact on the surrounding environment.

    The ozone layer is essential for absorbing potentially harmful UV radiation emitted by the sun. Still, it has been depleted by many chemicals that humans use to keep their homes cool. UV radiation has been associated with various adverse health effects, including sunburn, skin cancer, accelerated ageing, and blindness.

    What exactly makes up the ozone layer?

    Ozone (O3) is a naturally occurring gas with a pungent odour but is colourless and odourless to the human eye. It is created when certain bacteria in the atmosphere decompose organic substances in the environment. Normal oxygen molecules (O2) are unreacted and exposed to the sun’s ultraviolet radiation, which produces this substance. Because of a positive reaction that occurs in ozone, a considerable amount of the harmful radiation from the sun does not reach Earth.

    The ozone layer can be found in the stratosphere, located between the altitudes of six and thirty miles above the earth’s surface. There are only three ozone molecules for every ten million air molecules in the stratosphere, which is a percentage of 0.00006%. Even though it only makes up a tiny percentage of the atmosphere, ozone is crucial in ensuring that the sun’s rays are safe for all life forms.

    Natural processes produce ozone and then break it down. Still, artificial chemicals called CFCs in the atmosphere prevent new ozone from being Pradesh creation of a “hole in the ozone layer” has been attributed to the use of these chemicals, which were common ingredients in early refrigerants. It is more accurate to say that ozone depletion results in a weakening of the ozone layer than it is to say that actual holes are being created in the lactating.

    Just what do we mean when we talk about refrigerants?

    In early air conditioning systems, some of the refrigerants that were accessible included ammonia, methyl chloride, and sulphur dioxide. In the 1920s, methyl chloride and sulphur dioxide were banned from usage because of their toxicity and chlorofluorocarbons were introduced to take their place (CFCs). Before sulphur dioxide and methyl chloride risks were recognised, their use in the industry was prevalent for several decades.

    How much damage does it create in the ozone layer when refrigerants are used?

    It wasn’t until the 1970s that scientists realised the ozone layer was losing approximately 4% of its mass every decade. The significant decrease in ozone levels discovered for the first time in 1985 was attributed by the British Antarctic Survey to faulty instruments. It was established that the principal cause of the depletion was the excessive use of synthetic substances, such as CFCs, which were released into the atmosphere through the emission of aerosols and refrigerants. Ozone molecules are susceptible to damage from chlorine and bromine, which are produced when CFCs break down in the presence of sunshine.

    “Polar stratospheric clouds” form when temperatures drop below freezing, making polar regions more susceptible to ozone depletion. These clouds are the ideal environment for the chemical processes that deplete the ozone layer. Consequently, the amount of ozone in some regions is lower than the average for the entire planet, leaving behind “holes” or sparse areas.

    In the spring, there is a significant depletion of the ozone layer in the stratosphere above Antarctica, which results in the formation of the so-called Antarctic ozone hole.

    The importation of autos, boats, and others The air conditioner is commonly seen in homes, workplaces, and other types of buildings worldwide. Air conditioners are available in various sizes and configurations, ranging from enormous central chiller systems to small window units. However, they all have in common: they utilise refrigerants to eliminate heat.

    What is the Montreal Protocol?

    In September 1987, the Montreal Protocol, which aimed to eradicate ozone-depleting refrigerants, became legally binding. This agreement outlined a timetable for developing zone-safe substitutes for the substances that deplete the ozone layer. There has not been another international agreement that has received as many signatures as this one has (197 countries).

    The usage of refrigerants that deplete the ozone layer and, more subsequently, refrigerants that contribute to global warming has significantly decreased since the pact was implemented

    Which of these refrigerants poses the most significant?

    The main uses of ozone-depleting substances include:

    CFCs and HCFCs in refrigerators and air conditioners,

    HCFCs and halons in fire extinguishers,

    CFCs and HCFCs in foam,

    CFCs and HCFCs as aerosol propellants, and

    methyl bromide for fumigation of soil, structures and goods to be imported or exported.

    Chlorodifluoromethane was a common refrigerant used in older models of air conditioning units for homes (R-22). Both the ODP and GWP values of the refrigerant R-22 are incredibly high (GWP). Currently, the Environmental Protection Agency is working on outlawing this drug.

    Even though it does not include chlorine, its successor, R-410A, also has a high global warming potential (GWP). Chemists are still looking for the “ideal” refrigerant, but they are not optimistic that they will find it soon. All we can do is keep our fingers crossed that choices like this will quickly become more mainstream.

    Making the switch to a more modern air conditioner that uses less hazardous refrigerants and looking at energy-saving efficiency star-rated appliances can help us use refrigerant-based equipment more efficiently.

    Think about this:

    Even if your existing air conditioner is only ten years old, the Environmental Protection Agency (EPA) predicts that you might save hundreds of dollars by replacing it with a newer one that has improved energy efficiency. If you still have a gadget that employs refrigerants that are harmful to the ozone layer, you should get in touch with Applewood as soon as possible. Allow us to assist you in the process of upgrading your system.