Tag: calculate carbon footprint

  • What is Carbon Footprint (Co2 emission)?

    What is Carbon Footprint (Co2 emission)?

    “Carbon footprint” refers to the total amount of carbon dioxide (CO2) emissions produced by an individual or organisation (e.g., building, corporation, country, etc.). It factors in both direct and indirect emissions, the former coming from the burning of fossil fuels in production, heating, and transportation and the latter from the generation of electricity, which is then used in the production of the goods and services that consumers purchase. Beyond carbon dioxide, other greenhouse gases like methane, nitrous oxide, and chlorofluorocarbons are often included in discussions of a “carbon footprint” (CFCs).

    Ecological footprints were first proposed in the early 1990s by Canadian ecologist William Rees and Swiss-born regional planner Mathis Wackernagel at the University of British Columbia. It was from the idea of an ecological footprint that the concept of a carbon footprint grew. An ecological footprint is the total area of land needed to sustain a given population or activity. Considerable quantities of both water and land are required for food production. Conversely, a carbon footprint is typically presented as a weight, such as tonnes of CO2 or CO2 equivalents produced annually.

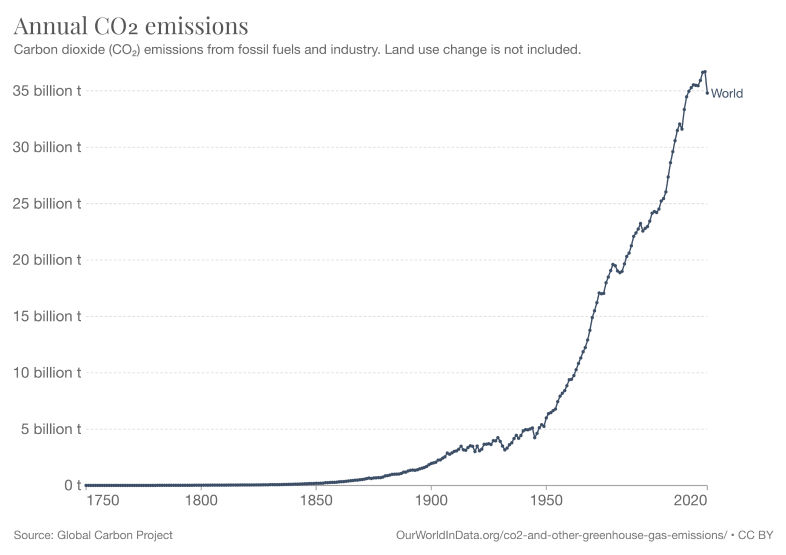
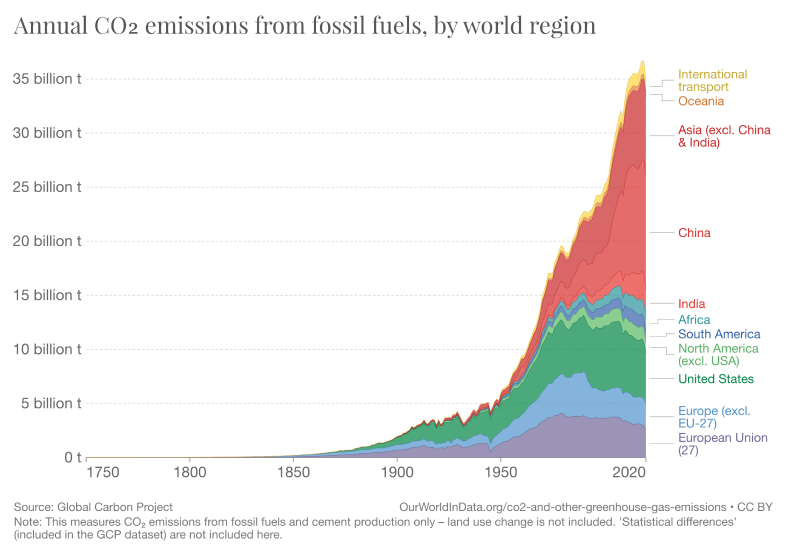
    How has the historical pattern of carbon dioxide (CO2) emissions changed around the world?

    From the middle of the 18th century to the present day, global emissions are shown to have steadily increased.

    We can see that emissions were significantly lower before the Industrial Revolution. Up until the middle of the twentieth century, emissions growth was slow. In 1950, human activity caused global CO2 emissions of 6 billion tonnes.

    More than 22 billion metric tonnes were produced by 1990, more than four times as much as in 1970. There has been a rapid increase in emissions, and we now produce more than 34 billion tonnes of pollution annually.

    While emissions growth has slowed in recent years, they have not yet reached their maximum level.

    We can see how the carbon emission has region-wise in last few decades. Europe and the United States dominated global emissions until the late twentieth century. From 1900 to 1950, Europe and the United States accounted for over 85% of annual emissions; by 2000, that number had only slightly decreased.

    Recent decades, however, have seen a dramatic shift in this regard.

    As the 20th century progressed, the rest of the world saw a dramatic increase in its emissions, especially in Asia and, most notably, China.

    Only about a third of emissions come from the United States and Europe.

    Which country or region produces the most CO2 annually per capita?

    When we divide a country’s total emissions by its population, we get an estimate of what each country’s citizen of that country contributes. This gives us an estimate of CO2 output per person.

    The said analysis focuses on emissions generated within national borders, independent of international trade in goods. What happens to these numbers when we factor in international trade is the subject of much larger discussion basis the consumption-based emissions. Production numbers matter because they are used to set climate goals. Thanks and thanks to historical reconstructions, we have global production data for the entire planet dating back to the middle of the 18th century.

    Emissions per person vary significantly from one region of the world to another.

    Major oil producers are also among the world’s highest per capita CO2 emitters, especially those with small populations. They are primarily located in the Middle East: With 49 tonnes (t) per capita emissions in 2017, Qatar ranked first, followed by Trinidad and Tobago (30 t), Kuwait (25 t), the United Arab Emirates (25 t), Brunei (24 t), Bahrain (23 t), and Saudi Arabia (19t).

    To counteract this, many of the world’s top oil producers have small populations and thus low total annual emissions. The United States, Australia, and Canada are all highly populated countries with correspondingly high levels of total emissions due to their high per capita emissions. Australia has the largest average footprint, at 17 tonnes per person, followed by the United States (16.2 tonnes) and Canada (15.6 tonnes).

    The 2017 worldwide average was only 4.8 tonnes per person, which is more than three times higher than that. It stands to reason that countries with high standards of living also have a large carbon footprint, as there is a strong correlation between GDP and CO2 emissions per person. It becomes apparent, however, that countries with similar living standards can have vastly different per capita emissions. Numerous European countries, for instance, produce fewer greenhouse gas emissions than either the United States or Canada.

    The emissions of some European countries are not too far above the global average: There were 5.3 tonnes of emissions per person in Portugal in 2017, 5.5 tonnes in France, and 5.8 tonnes in the United Kingdom. This is considerably less than the sums spent on a similar lifestyle in neighbouring countries like Germany, the Netherlands, or Belgium. The electricity mix varies widely from country to country, depending on factors such as the share of electricity generated by nuclear and renewable sources. As a result, fossil fuels generated caused a much smaller percentage of electricity; in 2015, only 6% of France’s electricity came from fossil fuels, while that percentage was 55% in Germany.

    Clearly, policy and technological decisions make a difference, but prosperity is still the primary driver of CO2 emissions.

    There are still many countries with relatively low CO2 emissions per person. The annual average footprint is around 0.1 tonnes in many of the poorest countries in Sub-Saharan Africa, including Chad, Niger, and the Central African Republic. Compared to the United States, Australia, and Canada, that is over 160 times lower. It takes a Malian or Nigerien a whole year to equal what the average American or Australian emits in just 2.3 days. India’s average carbon footprint is 2.8 tonnes.
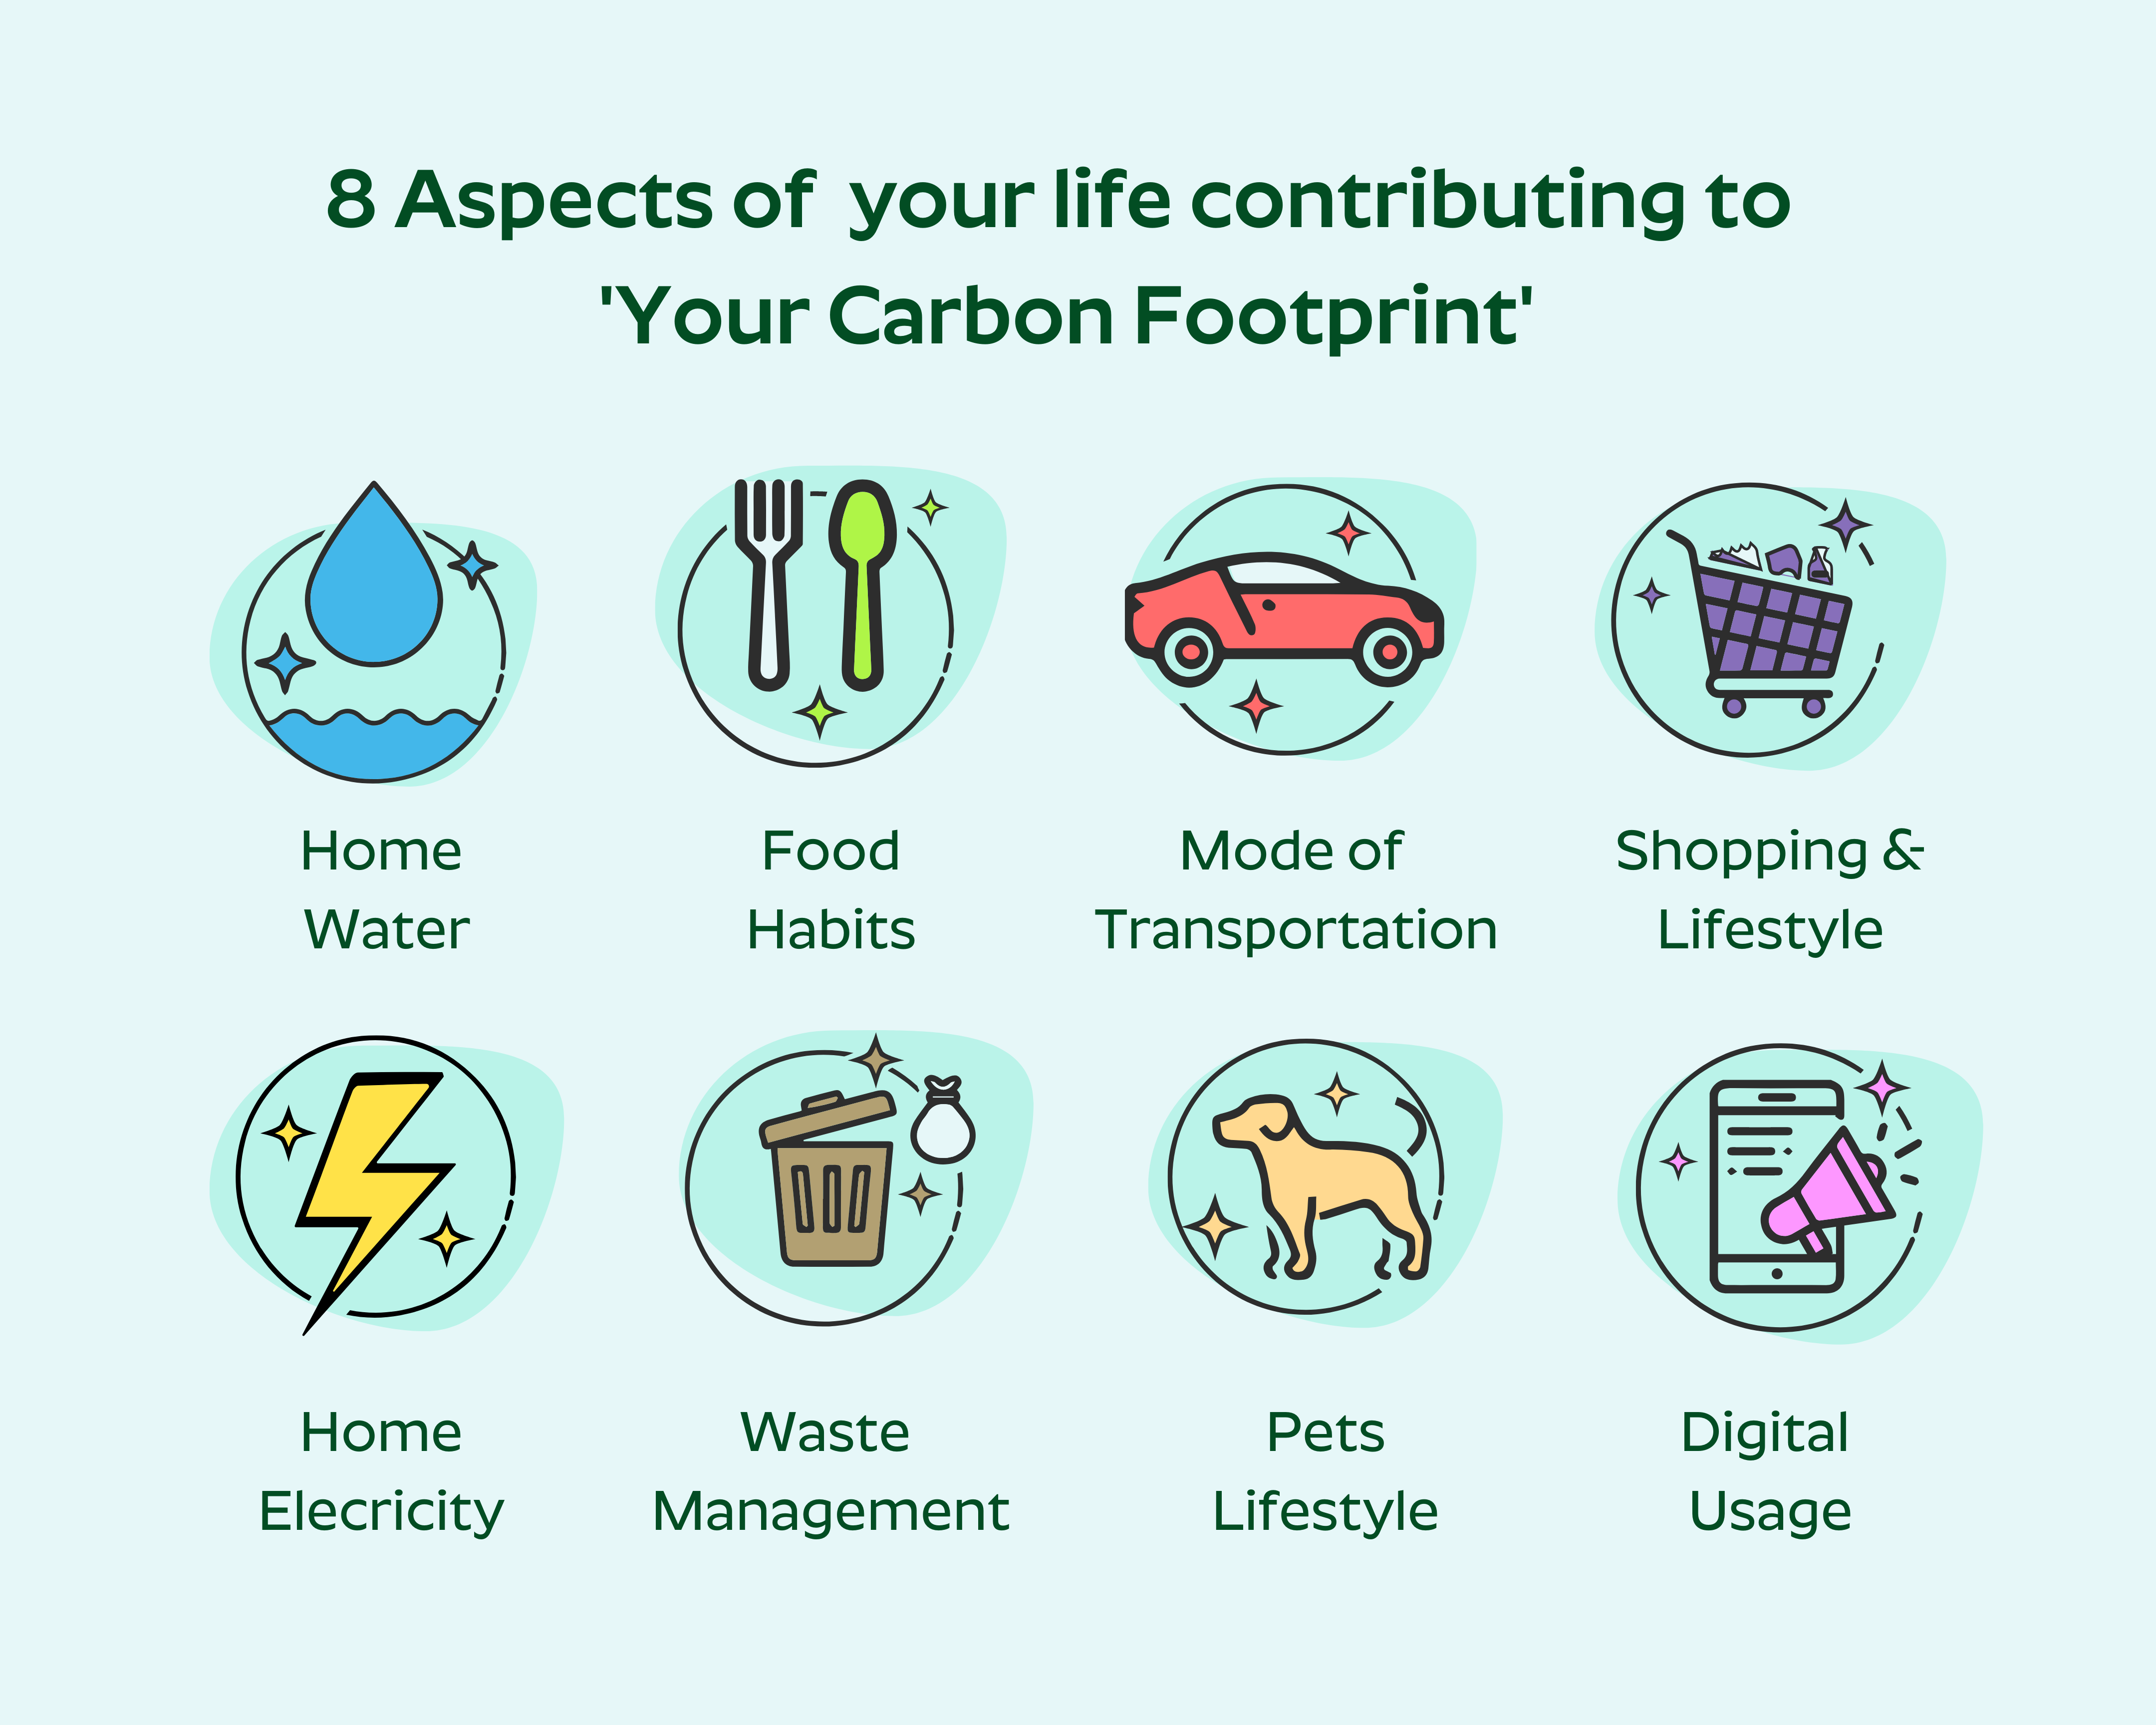
    Think about this:

    One of the significant aspects of carbon emission in today’s digitally evolved world is the average usage of technology by the country’s population of each count. With the rise of 5G data and smartphones in every remote area of the world, carbon emission has increased. It is we who need to understand development comes at a cost, and we must create harmony while we soring high the waves of development.

    It is possible to neutralise carbon and create a much more harmonious world by evaluating and understanding the impact of carbon emissions on an individual level. If we all do our part, the world we leave for future generations will be much better than the one we inherited.

  • Why is offsetting necessary to create a better world?

    Why is offsetting necessary to create a better world?

    Carbon, carbon everywhere, are we waiting for the day when there will be no clean air?

    The global effort to reduce emissions of greenhouse gases (GHGs) and mitigate warming and climate change includes measures to reduce carbon dioxide (CO2) emissions. Even if reducing emissions of other greenhouse gases like methane is vital, reducing carbon dioxide emissions is the essential thing that can be done to address climate change.

    Myplan8 is working hard to develop the infrastructure needed to make it easy for individuals to offset their carbon emissions transparent and verifiable. Nonetheless, how efficient are these carbon offsets? In this article, we’ll go into greater detail about carbon offsetting, explaining what it is and how it can help reduce your carbon footprint.

    What is carbon offsetting?

    Carbon offsetting involves compensating a third party for your own greenhouse gas emissions by paying them to remove an equivalent amount of carbon dioxide and other gases from the atmosphere. This is reported in terms of carbon dioxide (CO2e) equivalents because CO2 is the most prevalent greenhouse gas.

    Carbon offsetting can be done for a single action, like taking a flight, or for an organization’s entire set of actions. Carbon credits, which are generated when carbon capture technologies successfully remove CO2 from the air, are the primary tool for offsetting. People and organisations can become carbon neutral if they purchase emission offsets to make up for their own emissions. A carbon credit’s associated carbon must be retired after it is purchased. Retirement of credits implies that the offsets linked with them cannot be counted again, which eliminates the possibility of double counting credits and ensures that emissions reductions are more accurately reflected.

    Compliance carbon market participants must use verified emission reductions (VERs), while voluntary carbon market participants use certified emission reductions (CERs) (CERs). Cap-and-trade systems, which feature their own compliance market, primarily target larger, carbon-intensive businesses and sectors. To avoid exceeding a government-mandated cap on emissions, businesses in this market must purchase carbon offsets.

    It is the companies in the voluntary market that have chosen to offset their carbon emissions in an entirely voluntary manner. The meteoric growth of this industry over the past few years can be directly attributed to investor demand to only invest in companies with strong emissions reductions plans and other favourable ESG (environmental, social, and governance) criteria in place.

    The amount of carbon dioxide (CO2) that has been kept out of the air is commonly quantified in terms of kilogrammes or metric tonnes when discussing carbon offsets.

    Can carbon offsetting help us meet our emission reduction goals?

    Carbon offsetting works if it leads to a net decrease in atmospheric carbon, as would occur if polluting activities in one region were to reduce their carbon emissions. To counteract the emissions, you designate in your purchase, you must use carbon offsets that capture a verifiable amount of carbon.

    Although this is a commendable strategy, it shouldn’t make up all your climate change mitigation efforts. Source reductions are necessary to achieve net-zero emissions, which is preferable to carbon neutrality from an environmental perspective.

    Where Can I Find Some Good Cases of Carbon Offsets?

    Tree planting is a standard method of creating carbon offsets because trees can absorb and store carbon dioxide. Although this is not the only way to counteract carbon output, it is the most popular and effective approach at the moment.

    The most well-known approaches to carbon offsetting involve tree planting and other forms of restorative forestry, but there are other possibilities. Methods currently in use for capturing carbon include direct capture from CO2 emitted by fossil fuels, capture and storage of CO2 and other GHGs that seep out of landfills, and renewable energy projects (or clean energy projects) that create carbon credits. Rather than destroying forests and the carbon they store, a new method of offsetting allows them to remain uncut. The local communities that rely on the forest for their livelihoods benefit from this, and the forest’s biodiversity is preserved.

    How can you tell if offsetting is effectively reducing your carbon footprint?

    If you want to make a severe dent in the amount of carbon pollution you are personally responsible for, offsetting your emissions with a reputable organisation is a must. Most offset programmes can be relied upon, including Terrapass’ offsetting based on personal carbon offset calculations. It will help if you determine which option best suits your needs. High-quality Offsets are more likely to come from programmes that third-party auditors have verified according to the Gold Standard or Verra VCS standards.

    Is It Possible to Neutralize My Carbon Footprint?

    Depending on your lifestyle, where you live, and your level of self-awareness, you may be able to offset your carbon footprint. Because your existence contributes to worldwide indirect (and probably direct) emissions, reaching carbon neutrality without offsetting your footprint is exceedingly tricky. CO2 is produced and released whenever an elevator is used in a high-rise building, or a meal is cooked on the street. Knowing how much carbon your lifestyle generates and how much you can offset is essential for reaching net-zero emissions.

    The less pollution you produce, the less effort will be needed to counteract it. The larger your carbon footprint, the more offsets you’ll need to compensate for your increased emissions.

    Myplan8’s new app will be able to provide some of the best and easy offsetting projects for you neutralise your impact on the planet.

    Think about this:

    If we plant enough trees, We can offset our carbon dioxide emissions.

    There are many variables that affect how many trees are needed to offset the effects of a ton of carbon footprint, such as the type of tree planted, the conditions in which it grows, the age of the tree, and so on. Myplan8’s data shows that you can offset 1 ton (i.e, 1,000 kgs) of your annual carbon emission by planting approximately 73 trees (i.e palm tree, 1361 kg, offset in 100 years, as we said the number will vary with the type of native tree). With the new Myplan8 app, you’ll be able to figure out exactly how much carbon you’re emitting and find an offsetting project to help you nuetralise it out.

  • What are the 8 main carbon footprint categories?

    What are the 8 main carbon footprint categories?

    If you think that the traditional – Roti, Kapda, aur Makaan is the only reason for your carbon footprint, you are in for a surprise!

    In the past two decades, things like ever-increasing purchases, internet discounts, repeat transactions, free data, and more have become standard fare. Let’s look at the eight factors that make up your carbon footprint.


    Home-Water: Water is used in many of the products we consume and utilise regularly. The average individual needs 5 litres of water daily to function in a calm atmosphere with light activity—the average American drinks between 100 and 175 gallons of water daily. Globally, we consume around 4 trillion cubic metres of fresh water yearly. On average, we use 25 litres to 50 litres for bathing.

    Home-Electricity: Have you ever looked at the actual units for the electricity and gas you use? It matters what kind of light bulb you use, what type of stove you have, and what kind of rating all your fancy appliances have. Here’s an interesting data point: Annual CO2 emissions from a single incandescent light bulb average 4,500 pounds. LED bulbs emit more than 1,051 pounds per hour, while CFLs emit less than 1,051.


    Food Habits: Fewer than one-third of Indians (and an even more significant proportion of low-income families) know that their food choices account for 10–30% of their carbon footprints. The majority of food-related emissions happen during production (68%).  In comparison, the carbon footprints of foods, including fruit, vegetables, legumes, and nuts, are much smaller. You can drastically reduce your carbon footprint by eliminating or reducing meat from your diet. Foods like this have the most carbon footprint.


    Waste management: Methane is produced through the anaerobic decay of trash in landfills, while nitrous oxide is released when we burn trash. Both of these contribute directly to greenhouse gas emissions.

    With only a third of the world’s food wasted, 3 billion people could be fed. According to a recent study, the average Indian throws away 137 grammes of food per day. That works up to 50 pounds yearly or 0.96 kilogrammes per week. India loses about Rs 92,000,000,000 annually due to the wasted 40% of its food supply. Reducing greenhouse gas emissions and conserving energy are two ways in which waste reduction and recycling contribute to combating climate change on a global scale.


    Mode of transportation: Do you prefer driving your car, even if just for a short distance, over walking or riding a bike? Hence, it is imperative that you read this information. The road sector, including both passenger and freight vehicles, is responsible for more than 92% of all transportation emissions. It also contributes significantly to the smog problem in India. The Center for the Study of Science, Technology, and Policy (CSTEP) used the Sustainable Alternative Futures for India (SAFARI) model to predict that in 2022, India’s transportation sector would be responsible for 375 million tonsof direct carbon dioxide emissions (Mt CO 2), or roughly 10% of India’s total greenhouse gas (GHG) emissions. Roads account for over 90%, followed by air and then rail (see Figure 1 for the break-up). By 2050, transportation-related emissions in India will have increased by more than three times, with the aviation sector responsible for a growing share of those emissions.


    Pets: To what extent do you like felines over canines? Among pet owners, these are the most popular choices. According to Sceince Focus, a medium-sized dog is estimated to release 770 kgs of CO2e yearly, while a medium-sized cat releases only 310 kgs. If you’re talking about a bigger barker, the number jumps up to 2,500 kgs. What cats and dogs consume in a year is the same as the carbon emissions from 13.6 million cars for a year.

    Shopping & Lifestyle: According to our calculation reflects that the average urban buyer can generates about 1,620 kgs of carbon dioxide yearly. Most buyers think it’s essential to find a way to showcase one’s individuality through one’s wardrobe. Companies and consumers alike will need to make modifications if we’re going to do a U-turn.

    This concept is gaining traction since most consumers are eager to make better purchasing decisions but lack the knowledge to do so. 


    Digital usage: According to a 2019 research by Satistica, roughly 4.1 billion people throughout the world have access to the Internet. By the billions, people are conducting searches, streaming videos, and using various forms of cloud computing, all of which contribute to the world’s insatiable appetite for energy and, by extension, to CO2 emissions. Their estimated share of world CO2 emissions ranges from 2.3% to 3.7%, depending on the study. This is equivalent to the emissions made by the entire aircraft industry. Individuals are more likely to arrive at a correct estimate of the volume of CO2 emissions and the ease with which they can be reduced. The introduction of 5G in India has been met with widespread enthusiasm. Because we are a developing nation, we must advance. Compared to 4G users, 5G users can use up to 2.7 times as much mobile data. Fifth-generation mobile networks (5G) make possible significantly higher average speeds than 4G and add a considerable amount of new capacity.


    We bet all this never crossed your mind…


    Calculating your carbon footprint is the first step toward minimising your environmental impact. If you find reducing carbon emissions challenging, you can use offsets to neutralise your footprint and achieve net zero. Myplan8’s proprietary calculator can help you track, reduce and offset your carbon footprint. A release date for the app will be announced soon.

    Think about this:

    Due to 5G, the video quality will improve.

    Let’s see some calculation:

    Streaming videos use 304,920 GWh per year.
    1 hr of video streaming: 1080p: ~1.9 to 2.55 GB/hr 4K:~3.5-7 GB/hr
    Energy intensity:4.94 kWh/GB
    Carbon Footprint: 0.0007tn
    Finding: Watching 1hr of 4K video produces 280.26 g of CO2
    5G user: 2.7x times = 756.70 g CO2

    Users of YouTube & Netflix will detect higher throughput, so they will automatically have higher data usage. People will change phones for higher output.

    Longer time will be spent on the phone, increasing screen time and creating health concerns. Myplan is about to launch India’s first carbon calculator including your digital behaviour.

  • Know the Average Carbon You Can Emit

    Know the Average Carbon You Can Emit

    An individual’s “carbon footprint” refers to the sum of all of their activities that release greenhouse gases such as carbon dioxide and methane into the atmosphere. One of the highest rates in the world, the average American leaves a carbon footprint of 16 tons each year. An estimated 4 tons of carbon dioxide emissions per person per year is the global norm.

    According to the available data, an average Indian emits 1.32 tons annually. However, this is averaged data and does not account for differences between urban and rural settings. In particular, the digital relics. There is a large discrepancy between these estimates. Despite being one of the most populous countries in the world, JIO has activated data in rural areas, and the country is transitioning to 4G and, eventually, 5G mobile networks.

    How is carbon emission of urban dweller different from rural?

    A recent study by the Research Institute for Humanity and Nature found that compared to low-spending households (those spending less than $1.9 per day), high-spending homes in India generate about seven times the amount of carbon emissions. India releases an average of 2.46 billion metric tons of CO2 equivalent per year into the atmosphere, accounting for 6.8% of global emissions. The average annual CO2 equivalent output per person in India is calculated to be 0.56 tons, with the poor responsible for 0.19 tons and the wealthy for 1.32 tons.

    According to IndiaSpend, the analysis found that across income levels in the country, the highest percentage of emissions was accounted for by spending on food and energy. The data utilised in the study came from the 2013 National Sample Survey Organisation (NSSO). The wealthy spent most of their money on private vehicles, durable goods, and non-cereal food products, all of which have a disproportionately high carbon footprint.

    An analysis of consumption data from 203,313 households in 623 districts revealed that programmes intended to benefit the poorly raised emissions by an added 1.97 percent, making this study the first of its kind to look at carbon emissions on a national, regional, and socioeconomic scale. The study indicated that if middle-class families in the country were moved into the higher expenditure group, carbon emissions would rise by 10%. The study found that if all Indians started consuming like the rich, emissions would increase by about 50 percent.

    This research supports other findings that have shown a significant gap between the global carbon footprints of the wealthy and those of the poor. According to the United Nations’ analysis of the “emissions gap,” the top 1% of the world’s wealthiest emit more carbon than the bottom 50% combined. More importantly, it concluded that the world’s wealthiest individuals must significantly cut their CO2 emissions by the century’s end if we are to avert a potentially disastrous rise in average global temperatures.

    The majority of carbon emissions in low-income houses came from using products, including detergents, soaps, and textiles. In contrast, the largest sources of carbon emissions in high-income homes were the use of durable goods and private vehicles.

    We can imagine that you are now wondering what factors within your personality make you who you are. Learn more about the topic by reading our blog, “What are the 8 primary carbon footprint categories?”

    Think about this:

    Annually, India generates 2.88 Gt of CO2 through its activities.

    141 crores, or nearly 493 million people, out of India’s total population of 142 crores live in urban regions (about 35 percent of the total).

    The average urban Indian generates 1.32 tons of carbon dioxide over the course of a year.

    The 493 million people who live in metropolitan areas in India are responsible for the production of 650 million tons (about 22 percent of the total) of CO2.